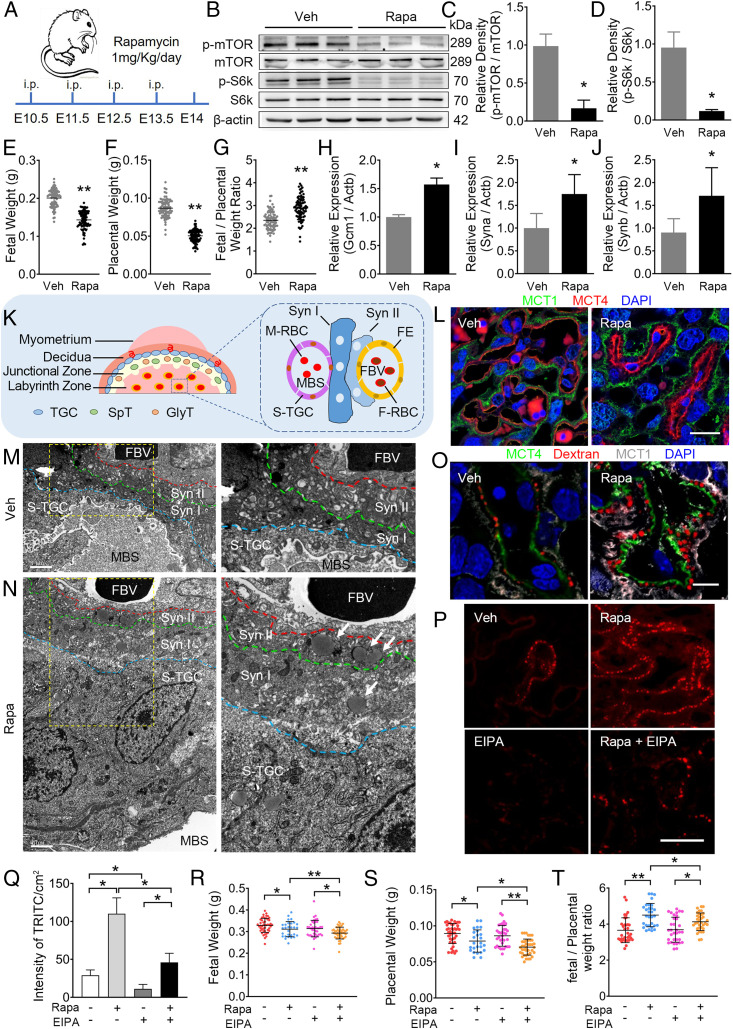
Fig. 4.
Inhibition of mTOR signaling by Rapa in pregnant mice leads to enhanced trophoblast syncytialization and macropinocytosis. (A) A schematic depiction of the experimental settings. Pregnant CD-1 mice were intraperitoneally injected with 1 mg/kg Rapa or vehicle (DMSO) daily from E10.5 to E13.5, and the mice were killed at E14. (B–D) Western blots (B) and the corresponding quantification (C and D) of p-mTOR, mTOR, p-S6k, and S6k in mouse placentas treated with vehicle (n = 10) or Rapa (n = 10). (C and D) Semiquantification of p-mTOR/mTOR and p-S6k/S6k. (E–G) FW (E), PW (F), and FW/PW weight ratio (G) in vehicle or Rapa dams. (H–J) mRNA levels of STB makers, Gcm1 (H), Syna (I), and Synb (J), in placentas from mice treated with vehicle or Rapa. (K) Schematic depiction of the mouse placenta. FE, fetal endothelium; FBV, fetal blood vessel; F-RBC, fetal red blood cell; GlyT, glycogen trophoblast; MBS, maternal blood sinus; M-RBC, maternal red blood cell; SpT, spongiotrophoblast; S-TGC, sinusoidal trophoblast giant cell; Syn I, the first layer of STB; Syn II, the second layer of STB; TGC, trophoblast giant cell. (L) Immunofluorescent staining of MCT1 (green), MCT4 (red) in the indicated placentas. Scale bar, 20 μm. (M and N) Representative TEM images of STBs in mouse placentas treated with vehicle (M, n = 6) or Rapa (N, n = 6). Right in M and N are the corresponding higher magnification images of the yellow frame Insets (Left). White arrows, large vesicles (0.2 to ∼5 μm in diameter, indicating macropinosomes) observed in Syn II of Rapa-treated mice. (Scale bars, 1 μm; magnification used in enlargements, 2×) (O) Three mice per group were subjected to single-injection of 2 mg/kg TRITC-dextran (intravenously) 3 min before being killed. Representative confocal images of TRITC-dextran (red) uptake in mouse STBs illustrated by MCT4 (green) or MCT1 (white) in vehicle or Rapa. (Scale bar, 20 μm.) (P–T) Pregnant CD-1 mice were injected from E10.5 to E13.5 with vehicle (DMSO, intraperitoneally and/or intravenously, n = 5), 1 mg/kg/d of Rapa (intraperitoneally, n = 5), 1 mg/kg/d of EIPA (intravenously, n = 5), and combination of Rapa and EIPA (n = 5), respectively. The placenta tissues were collected at E14. (P) Representative staining of TRITC-dextran (red) in the indicated E14 placentas of vehicle (DMSO, n = 3), Rapa- (n = 3), EIPA- (n = 3), and Rapa+EIPA- (n = 3) treated mice. (Scale bar, 40 μm.) (Q) Quantification of TRITC intensity in the indicated mouse placentas. (R–T) FW (R), PW (S), and FW/PW weight ratio (T) in vehicle-, Rapa-, EIPA-, and Rapa+EIPA-treated groups. The data are shown as mean ± SD, and the analysis was carried out by two-tailed t test (C–J) or one-way ANOVA test and Tukey–Kramer multiple-comparison test (Q–S). *P < 0.05; **P < 0.01.

