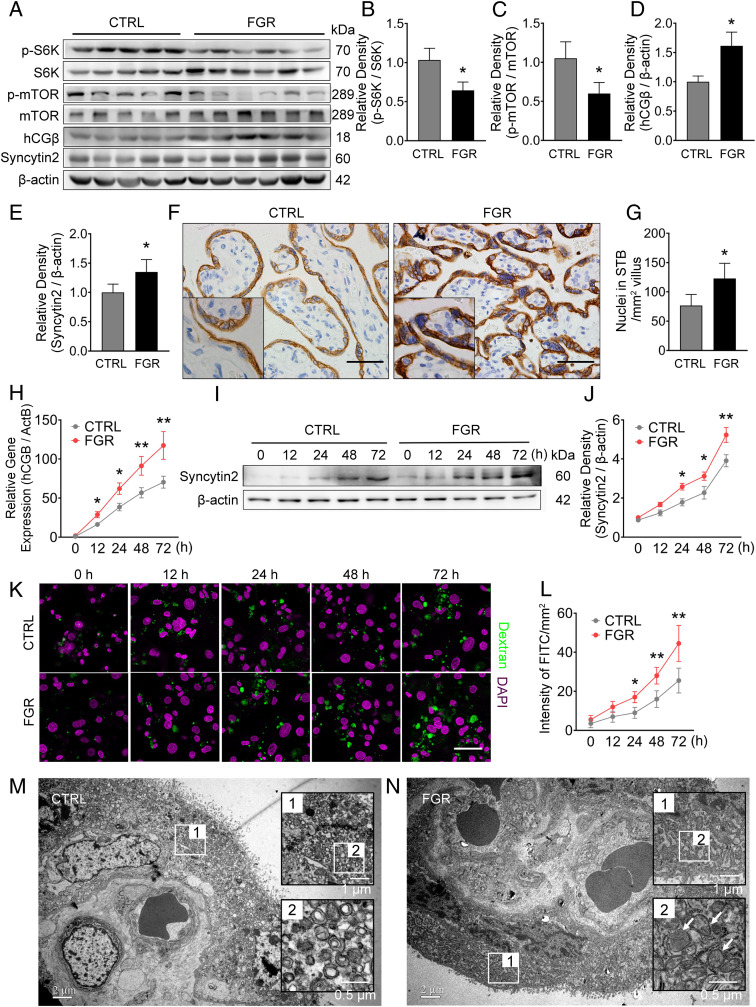
Fig. 5.
Syncytialization, macropinocytosis activity, and mTOR signaling in normal or FGR human placentas. Sixteen control and 14 FGR placentas were collected and analyzed. (A–E) Western Blots (A) and corresponding quantification (B–E) of p-S6K, S6K, p-mTOR, mTOR, hCGβ, and Syncytin2 in control and FGR placentas. (F and G) Quantification of the number of nuclei in STB of control and FGR placentas based on the immunohistochemistry staining of Cytokeratin 7 (F, higher magnification of images are displayed as Insets). (G) Quantification of nuclear number in STB. Three placentas from each group were included, and three slides per sample were subjected to immunohistochemistry. The number of nuclei in the STB was counted in five random fields of each slide and presented as nuclear number per square millimeter of villous area. The results are presented as mean ± SD, and statistically analyzed by two-tailed t test. (Scale bars, 400 μm; magnification used in enlargements in F, 2×) (H–J) mRNA level of hCGB (H) and Western blot of syncytin2 (I and J) in primary cultured trophoblasts derived from control or FGR placentas. (K) Representative images of FITC-dextran uptake indicating macropinocytosis in PHT cells derived from control or FGR placenta, with green and magenta signal indicating FITC-dextran and DAPI, respectively. (Scale bar, 20 μm.) (L) Quantification of FITC intensity. (M and N) Representative TEM images of STBs from normal pregnancy (M, n = 5) vs. FGR (N, n = 5) placentas. The panel in black frames are regional magnification of the corresponding white frames, with white arrows indicating large vesicles (0.2 to ∼5 μm in diameter, indicating macropinosomes) observed in the STBs of the FGR placenta. The data are shown as mean ± SD, analyzed by two-tailed t test based on the results from at least three independent experiments. *P < 0.05; **P < 0.01.

