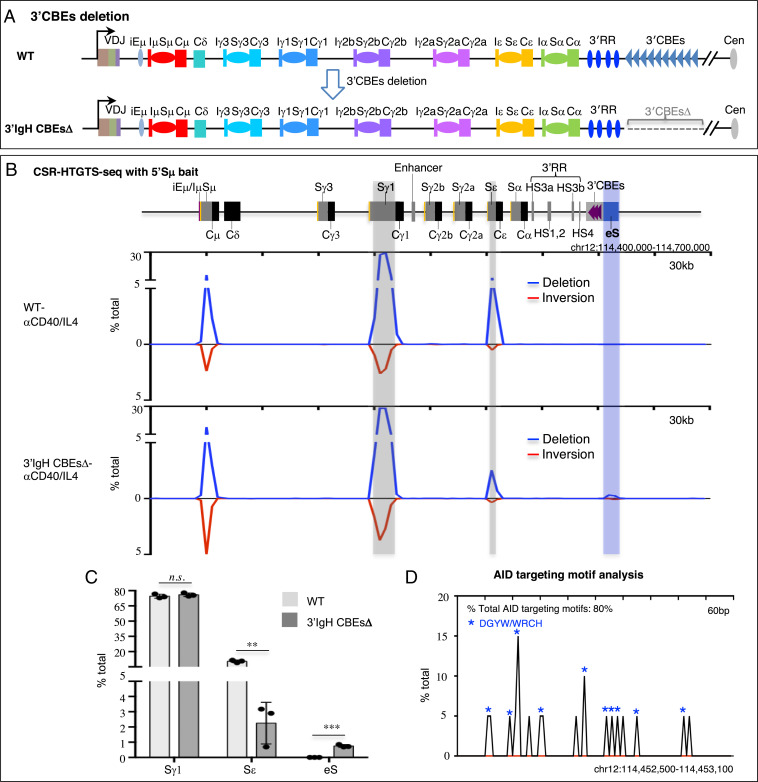
Fig. 1.
The 3′IgH CBEs deletion decreases Sε CSR and creates an eS region for aberrant translocation in αCD40/IL4-stimulated B cells. (A) Schematic of IgH locus from iEμ to 3′IgH CBEs and illustration of the generation of 3′IgH CBEs-deleted ES cells. (B) CSR-HTGTS-seq analysis of break joining between 5′Sμ and downstream acceptor S or non-S regions in WT and 3′IgH CBEs-deleted splenic B cells stimulated with αCD40/IL4. The blue line indicates deletional joining, and the red line indicates inversional joining. Gray bars highlight the Sγ1 and Sε. A blue bar highlights the ectopic S region (labeled as “eS”) just downstream of 3′IgH CBEs. (C) Bar graph showing percentages of junctions located in different S regions and the eS region from WT and 3′IgH CBEs-deleted splenic B cells stimulated with αCD40/IL4. Data represent mean ± SD from three independent repeats. P values were calculated via an unpaired two-tailed t test; n.s. indicates P > 0.05, **P ≤ 0.01, ***P ≤ 0.001. The raw data for this bar graph are summarized in SI Appendix, Table S1. (D) AID-targeting-motif analysis for the junctions located in a 600-bp region within the AID-targeted eS region from 3′IgH CBEs-deleted splenic B cells stimulated with αCD40/IL4. Blue asterisks indicate DGYW/WRCH motifs.

