Fig. 3.
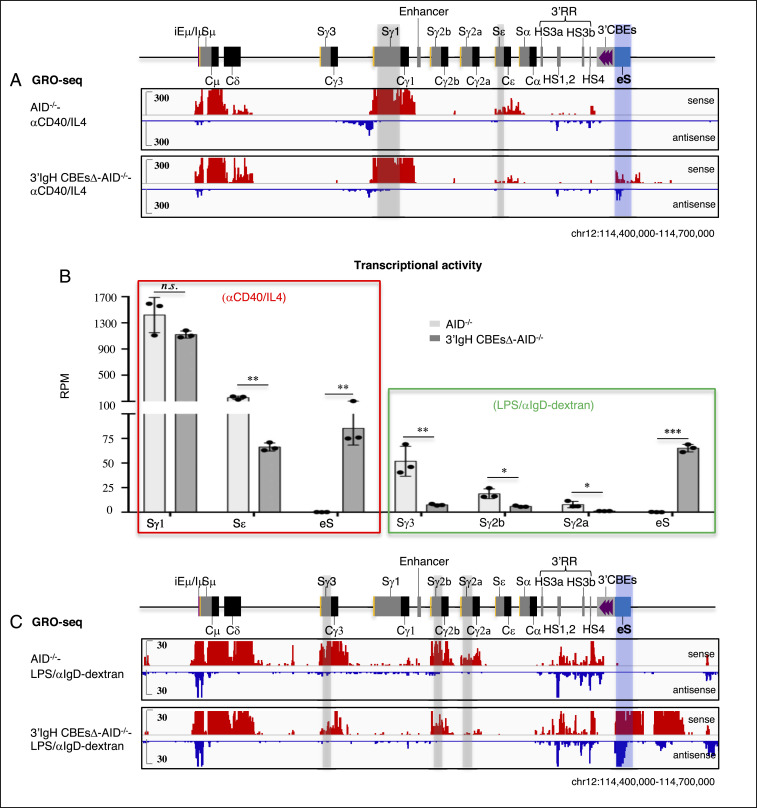
The 3′IgH CBEs deletion decreases transcription of the most upstream S region transcription and induces the transcription of the eS region. (A) GRO-seq profiles of the IgH locus from AID-deficient WT and 3′IgH CBEs-deleted splenic B cells stimulated with αCD40/IL4. Sense transcription is shown above in red, and antisense transcription is shown below in blue lines. Gray bars highlight the Sγ1 and Sε. A blue bar highlights the ectopic S region (labeled as “eS”) just downstream of the 3′IgH CBEs. (B) Bar graph shows GRO-seq transcriptional activity (calculated as RPM) of the different indicated S regions and the eS region in αCD40/IL4-or LPS/αIgD-dextran–stimulated AID-deficient WT and 3′IgH CBEs-deleted splenic B cells. Data represent mean ± SD from three independent repeats. P values were calculated via unpaired two-tailed t test; n.s. indicates P > 0.05, *P ≤ 0.05, **P ≤ 0.01, ***P ≤ 0.001. The raw data for this bar graph are summarized in SI Appendix, Tables S1 and S2. (C) GRO-seq profiles of the IgH locus from AID-deficient WT and 3′IgH CBEs-deleted splenic B cells stimulated with LPS/αIgD-dextran. Sense transcription is shown above in red, and antisense transcription is shown below in blue lines. Gray bars highlight the Sγ1, Sγ2b, and Sγ2a. A blue bar highlights the ectopic S region (labeled as “eS”) just downstream of the 3′IgH CBEs.

