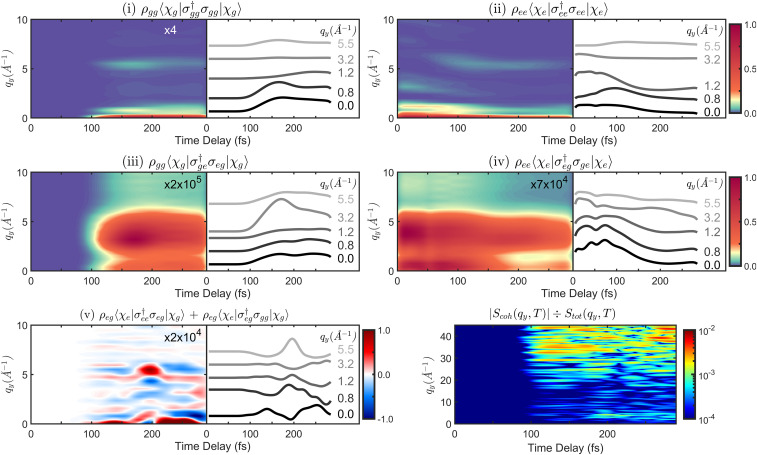
Fig. 6.
Time-resolved diffraction signal (Eqs. 2 and 3) using a 10-fs full width at half maximum probe pulse. We display the direction at = = 0, while similar observations can be made in all three directions. Signal contributions are scaled by the indicated factors and sorted similar to Fig. 3. Horizontal slices at characteristic values are given next to each diffraction pattern. Contributions i and ii are elastic scattering from ground and excited state. Contributions iii and iv are inelastic scattering from ground and excited state. The elastic and inelastic S0 signal contribution is zero before 100 fs due to no population and emerges after 100 fs with the wave packet relaxing to this state. In these four contributions, a distinct change in the diffraction pattern can be observed around 100 fs, where significant parts of the wave packet have left the cis side of the PES and evolve to the trans side. Contribution v is mixed elastic/inelastic scattering from the vibronic coherence (fifth term in Eq. 3). (Bottom Right) Ratio of the strength of the coherence contribution vs in the total signal, indicated with a logarithmic color scale. Being around times weaker at low values of , it gets gradually stronger at higher values and is only times weaker at 40 .

