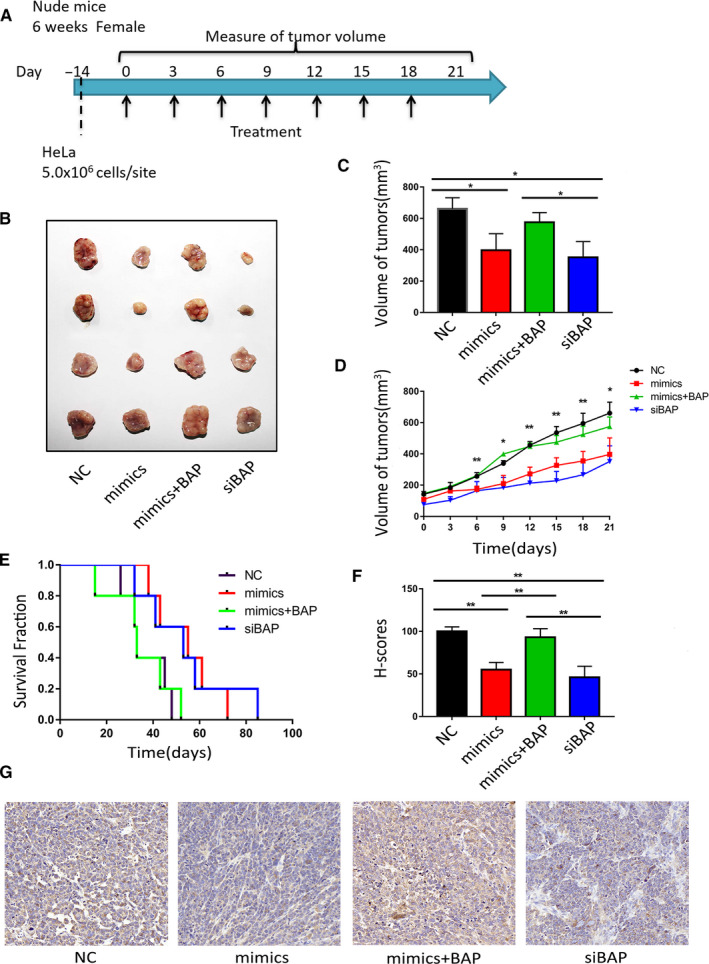
FIGURE 4.

MiR‐362 delays cervical cancer progression in vivo. (A) Implementation program of tumor‐bearing nude mice experiments. (B) Image of tumors after 3 weeks’ transfection. (C) Tumor volumes were measured after 3 weeks’ transfection. (D) Growth curve of xenografts of HeLa cells transfected with NC, mimics and siBAP. * showed the p value between mimics versus NC. (E) Kaplan–Meier means curve representing the overall survival of the injected mice. (F and G) H‐scores (histochemistry scores) and images (20×) of BAP31 immunohistochemical staining in tumor tissues from xenograft mouse model. *p < 0.05; **p < 0.01. Data are represented as the mean ± SD of at least three independent experiments
