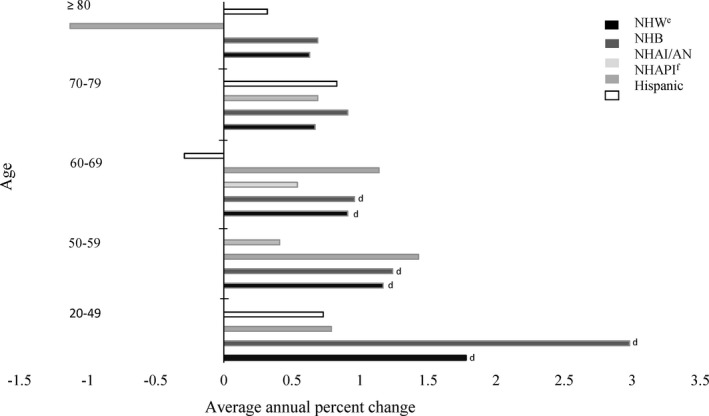
Figure 2.

Average annual percenta change in multiple myeloma incidence rates by race/ethnicityb, and age, among adults (individuals aged 20 years or older), United Statesc, 2003‐2016. aAverage annual percent change (AAPC) was calculated using join point regression. bRacial and ethnic groups are mutually exclusive. Hispanic persons can be any race. Rates are not presented for those with. cData are compiled from cancer registries that meet data quality criteria covering 100% of the U.S population during 2003‐. dIndicates the AAPC was significantly different from zero (P < .05). eNHW = non‐Hispanic White; NHB = non‐Hispanic Black; NHAI/AN = non‐Hispanic American Indian/Alaskan Native; AAPC for APIs was not included for ages 20‐49, 50‐59, 40‐79, and ≥ 80 due to case counts < 16 for certain years
