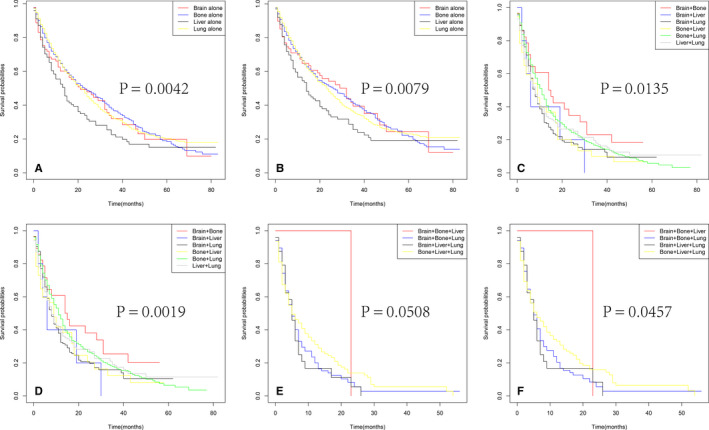
FIGURE 5.

Kaplan–Meier curves of OS in patients according to metastatic status: with single site (A), with two sites (C), with three sites (E). Kaplan–Meier curves of CSS in patients according to metastatic status: with single site (B), with two sites (D), with three sites (F)
