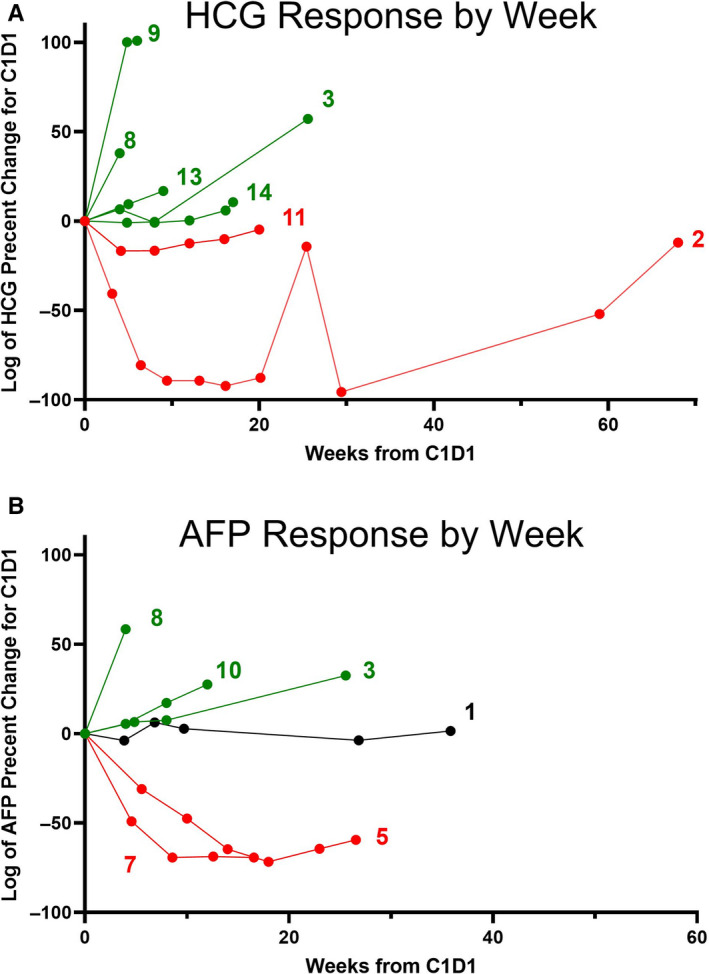
Figure 2.

Percent change in testicular germ cell tumor markers as compared with baseline. (A) Log of the percent change in hCG serum levels in individual patients compared to C1D1. Only patients with a C1D1 hCG level >10 are included. Patients with declining levels are in red, patients with increasing levels are in green. (B) Log of the percent change in AFP serum levels in individual patients compared to baseline. Only patients with a baseline AFP level >25 are included. Patients with declining levels are in red, patients with increasing levels are in green. Patient with mixed/unchanged level is in black
