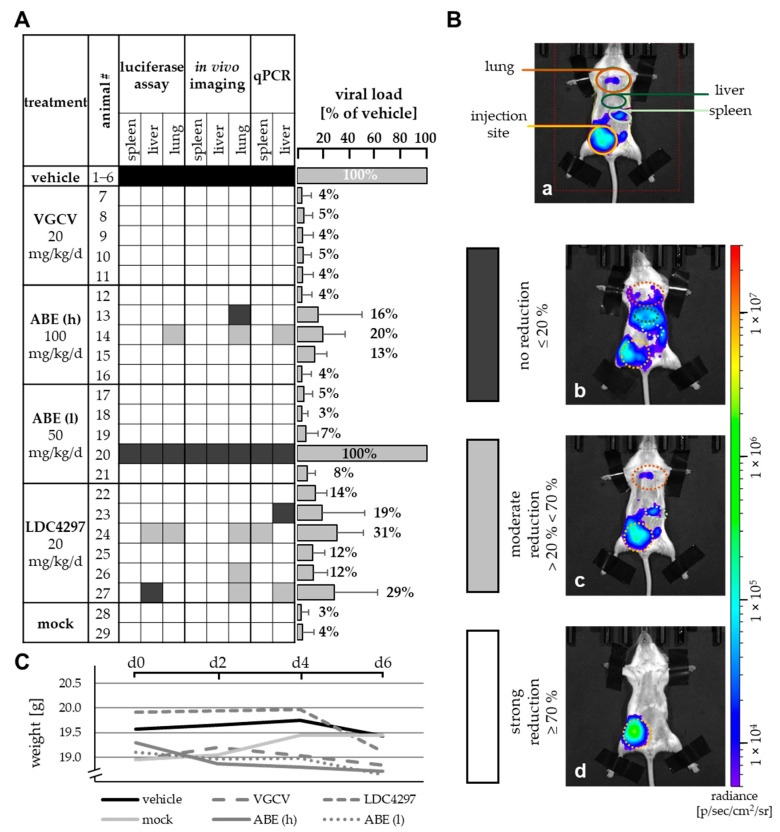
Figure 3.
Reduction of viral load by PKI treatment. (A) Viral load in spleen, liver and lung was measured using in vitro luciferase assay, in vivo luciferase imaging and viral genome-specific qPCR and was compared to the mean value of viral load of six vehicle-treated mice. No, moderate or strong reduction is indicated by black, grey or white colored boxes, respectively, as indicated in panel B. Grey bars on the right indicate mean values + SD of viral load for each animal in all eight analyzed organs/methods (see also percentages given above of each bar). (B) Exemplary pictures of in vivo luciferase imaging. Mice were fixed, sedated and injected with luciferin solution. Organ-specific luciferase activity was measured according to regions of interest marked in image a. Pictures show exemplary animals for the categories used in panel A, i.e., no reduction (image b), moderate reduction (image c), strong reduction (image d). (C) Weight of treated animals as determined on days 0, 2, 4 and 6. Data are given as mean weight in each treatment group. VGCV, valganciclovir.

