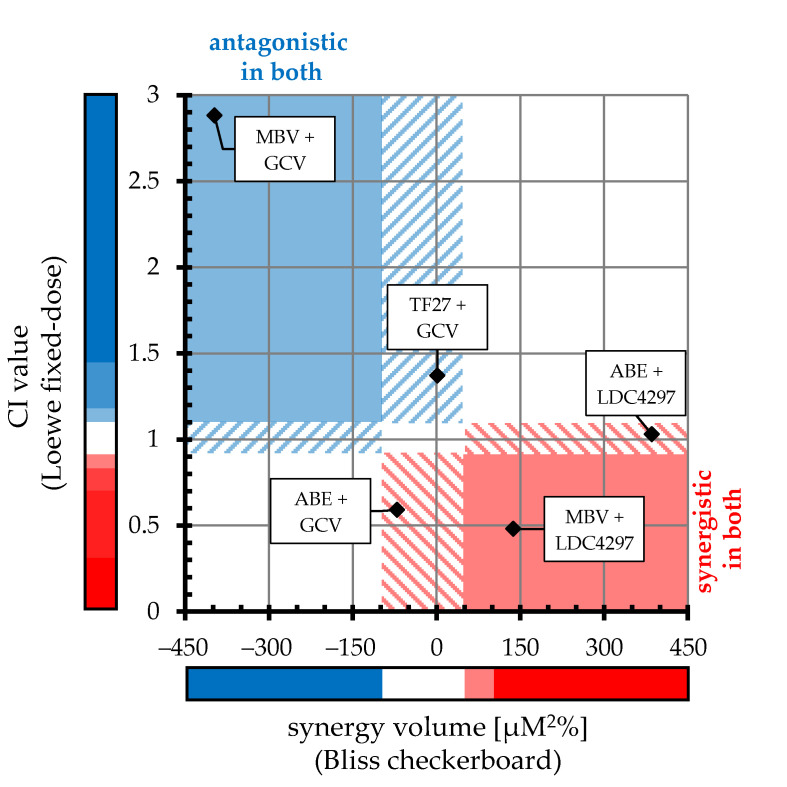
Figure 7.
Comparative alignment of HCMV-specific Loewe fixed-dose and Bliss checkerboard results. X-axis value of each drug combination indicates mean synergy volume across checkerboard assays (positive and negative synergy volumes were added together to acquire one plottable value). Y-axis value indicates mean CIwt across fixed-dose assays. Colored bars represent ranges of antagonistic (blue), additive (white) and synergistic (red) interactions for each approach (specified in Table 2 and Table 3). Solid blue/red fields within the chart indicate overlapping antagonistic/synergistic range of both approaches, respectively; dashed blue/red areas designate antagonistic or synergistic ranges in one method with additive values in the other method.

