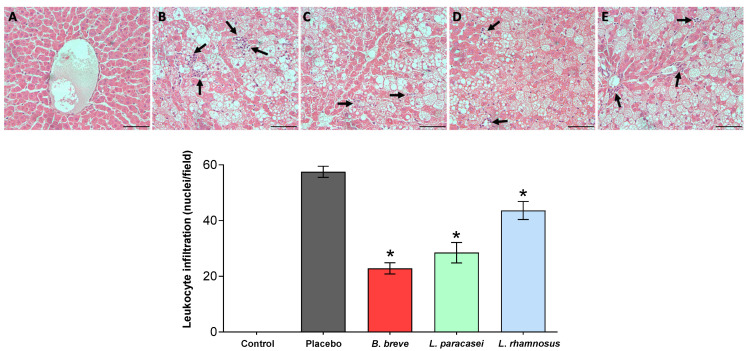
Figure 5.
Inflammatory cell infiltration. Upper panels: Representative micrographs of 5-µm-thick liver sections stained with hematoxylin and eosin (H&E) of (A) control group, (B) placebo group, (C) B. breve group, (D) L. paracasei group, and (E) L. rhamnosus group. Bars = 20 µm. Lower panel: Quantification corresponding to the stained sections. Values are the means ± SEM, n = 3–4 per group. * p < 0.05 vs. placebo. B, Bifidobacterium; L, Lactobacillus.

