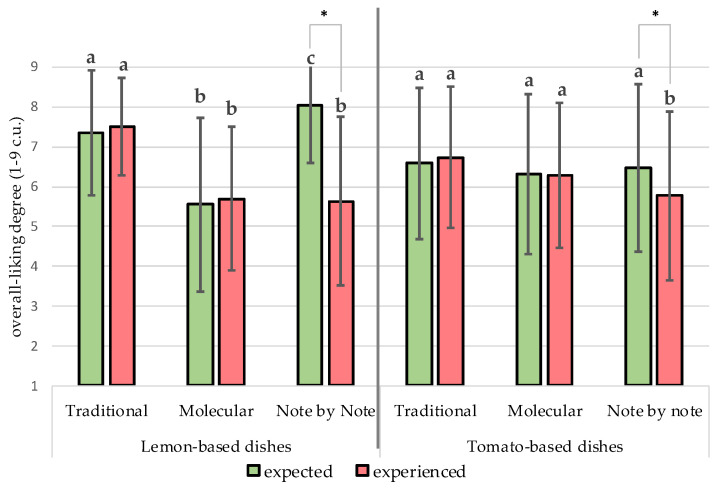
Figure 3.
Expected and experienced overall liking in relation to dishes: a, b, c—values of expected-liking or experienced-liking that are marked by different lowercase letters between various versions of dishes with the same main ingredients differ significantly at p ≤ 0.05; * asterisk brackets indicate a significant difference between expected and experienced overall liking of the given sample at p ≤ 0.05.

