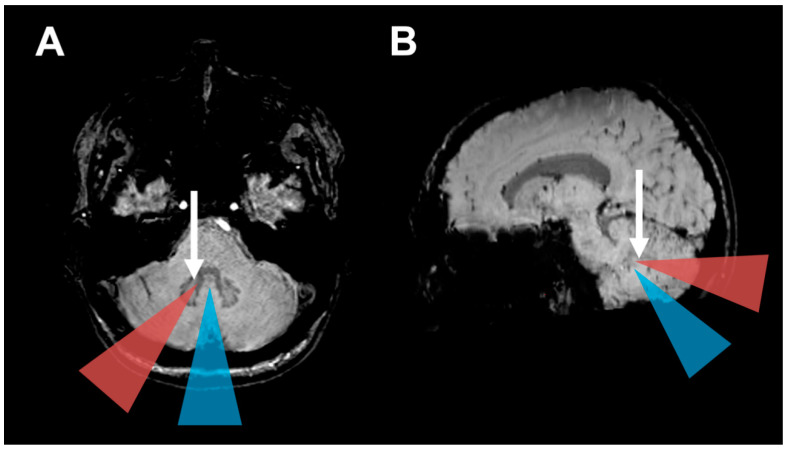
Figure 3.
HOD development based on operative approach: (A) Axial and (B) parasagittal magnetic resonance susceptibility-weighted images (SWI) illustrate the operative approaches investigated in this study. The blue triangles indicate midline approaches (telovelar and transvermian). The orange triangles indicate the paravermal trans-cerebellar operative corridor that frequently led to hypertrophic olivary degeneration in our cohort by injury to the dentate nucleus (Arrows).

