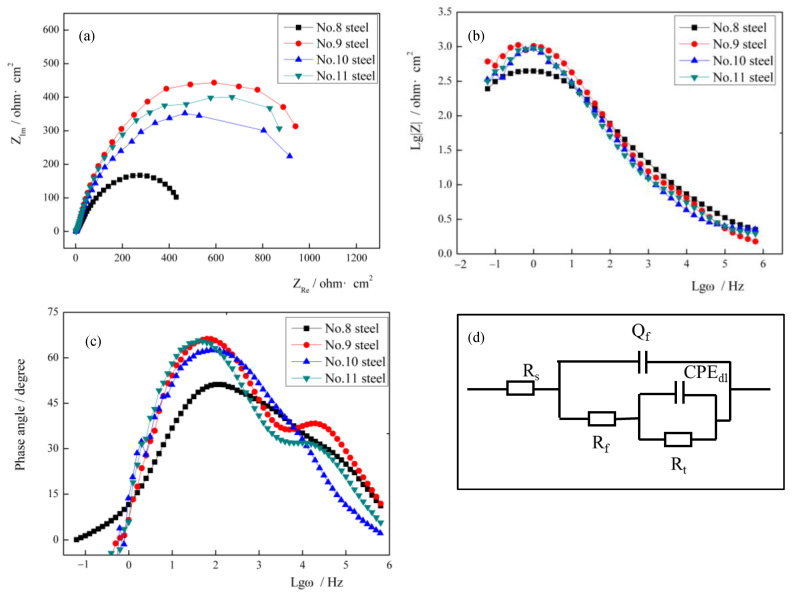
Figure 5.
(a) Nyquist plots, (b) Lg Z—Lg ω Bode plots and (c) phase angle—Lg ω Bode plots of four types ULCB steels samples with different content of niobium in 3.5 wt.% NaCl solution and (d) equivalent circuit to fitting EIS data (Here, Rs represents solution resistance; Cc and Rc refer to the capacitance of corrosion products film and its resistance, respectively; Cd is the capacitance of double electrode layer, and Rt stands for charge transfer resistance).

