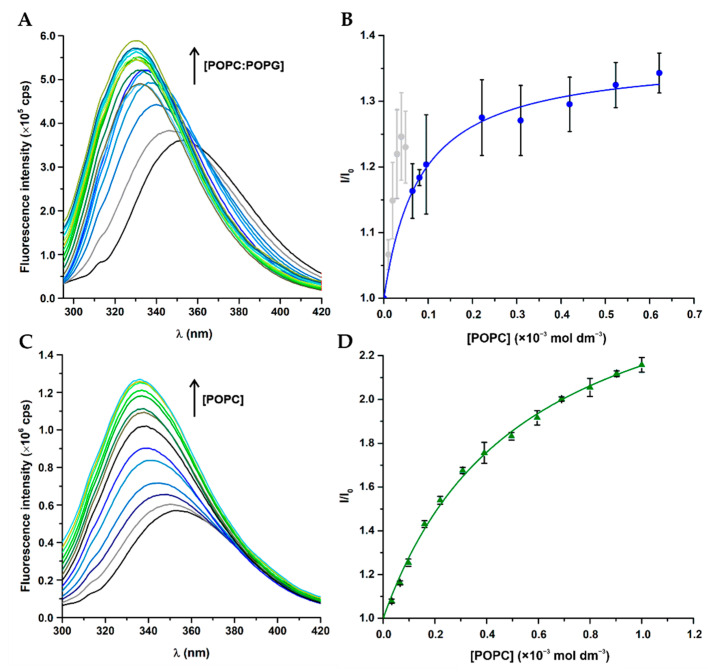
Figure 2.
Membrane partitioning of W-BP100 in anionic and zwitterionic model membranes determined by steady-state fluorescence spectroscopy. Representative fluorescence emission spectra of W-BP100 in presence of (A) POPC:POPG (1:1) and (C) POPC LUV. (B,D) Spectral lines of the non-linear fitting of experimental data to the simple partition model in Equation (2). Data points and error bars are the mean ± SD of three independent experiments.

