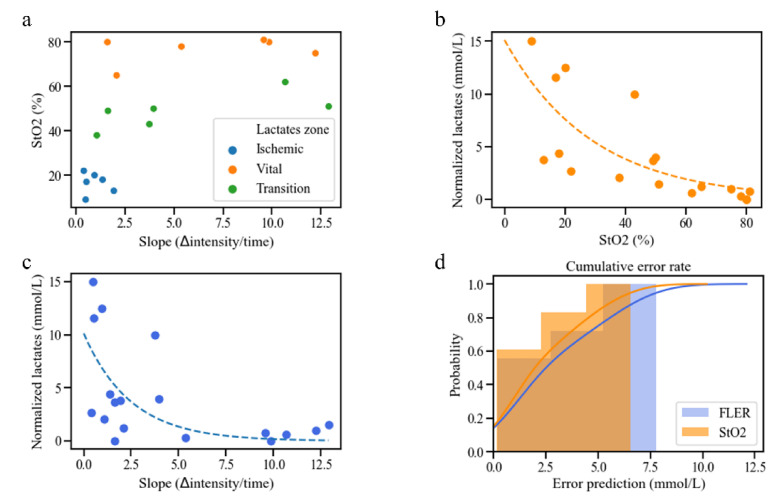
Figure 3.
Analyses between HSI-StO2 and the FLER-slope. (a) Correlation analysis between HSI-StO2 and the FLER slope in correspondence with the same ROIs showed a R = 0.697 (p = 0.013). (b) Correlation analysis showed a R = −0.88 (p < 0.001) between LCLs and HSI-StO2, (c) and a R = −0.608 between LCLs and the FLER slope (p = 0.0074). (d) HSI-based and FLER-based lactate prediction models had statistically similar predictive abilities (p = 0.112). See the following link URL for the explanation of the unit of slope (∆intensity/time). https://www.quora.com/What-is-the-unit-of-a-slope.

