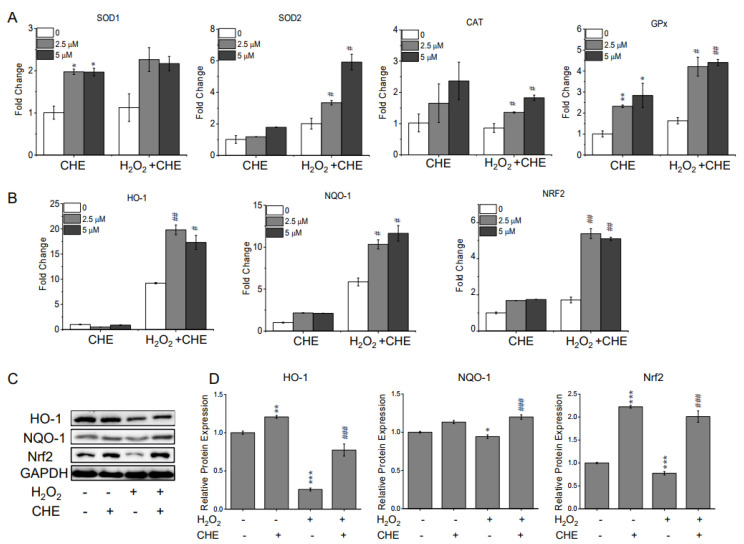
Figure 3.
Involvement of the HO-1/ Nrf2 axis in the antioxidant effects of CHE. Cells were pre-treated with 2.5 or 5 μM CHE or 0.1% DMSO (vehicle control) for 2 h and then incubated with or without 500 μM H2O2 for an additional 24 h. Afterwards, the cells were harvested to extract RNA and protein. Expression analysis of antioxidant marker genes via RT-qPCR. All the gene expression data were analyzed using Student’s t-test (A,B). (C) Cells were pre-treated with 5 μM CHE or 0.1% DMSO for 2 h and then incubated with or without 500 μM H2O2 for an additional 24 h. HO-1, NQO-1, and Nrf2 protein levels were quantified via Western blot analysis. (D) HO-1, NQO-1, or Nrf2 expression level was plotted relative to the control level. * p < 0.05, ** p < 0.01, *** p < 0.001, versus the control group; # p < 0.05, ## p < 0.01, ### p < 0.01, versus the H2O2-treated group.

