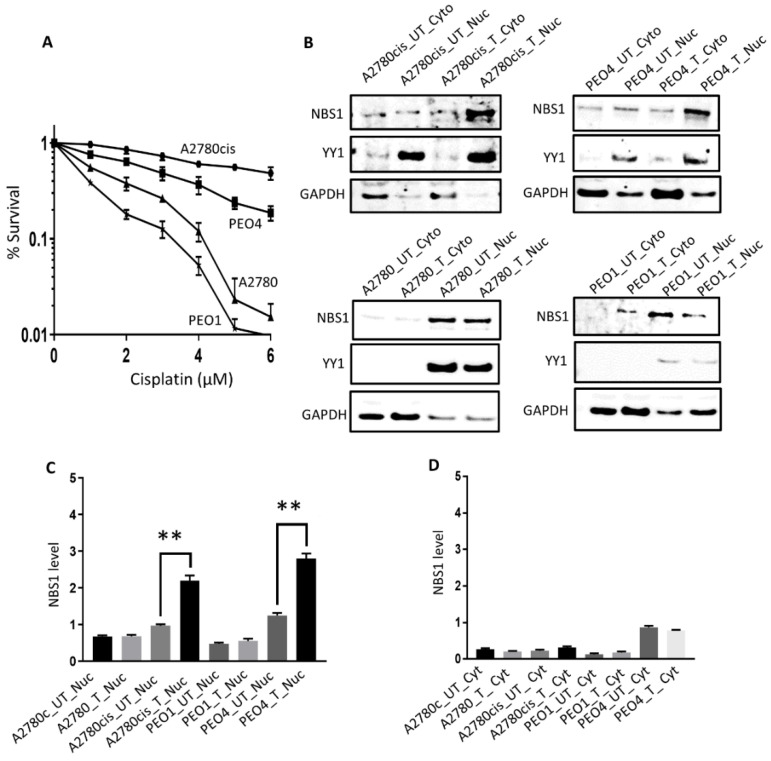
Figure 2.
Sub-cellular localization of NBS1 following cisplatin in ovarian cancer cells. (A) Clonogenic assay showing Cisplatin sensitivity in A2780, PEO1 compared to A2780cis and PEO4 cells. (B) NBS1 level nuclear and cytoplasmic extracts in platinum resistant (A2780cis, PEO4) and platinum sensitive (A2780, PEO1) cells treated with 5µM cisplatin. Lysates collected 48 h post-treatment. (C) NBS1 nuclear level quantification A2780, A2780cis, PEO1, and PEO4 cells. (D) NBS1 cytoplasmic level quantification A2780, A2780cis, PEO1, and PEO4 cells. UN = untreated, T = treated. ‘**’ = p value < 0.001.

