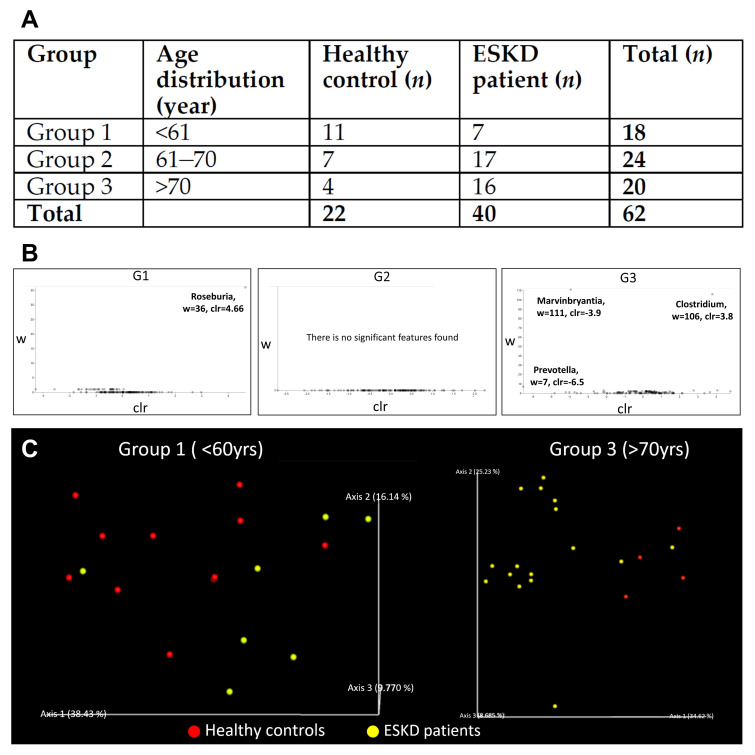
Figure 2.
(A) Descriptive characteristics of the study population. (B) Differential abundance analysis of microbial at the genus level. (C) Multidimensional scaling ordination plot of the fecal bacterial community. The overall bacterial compositions can be used to separate most ESKD patients and healthy controls into two groups. (G1) Most ESKD patients were separated from healthy controls with only one exception. (G3) In the elder group, ESKD patients were separated from healthy controls. UniFrac distance metric was used to calculate the pairwise distances between samples. Healthy controls and ESKD patients were shown in red and yellow, respectively.

