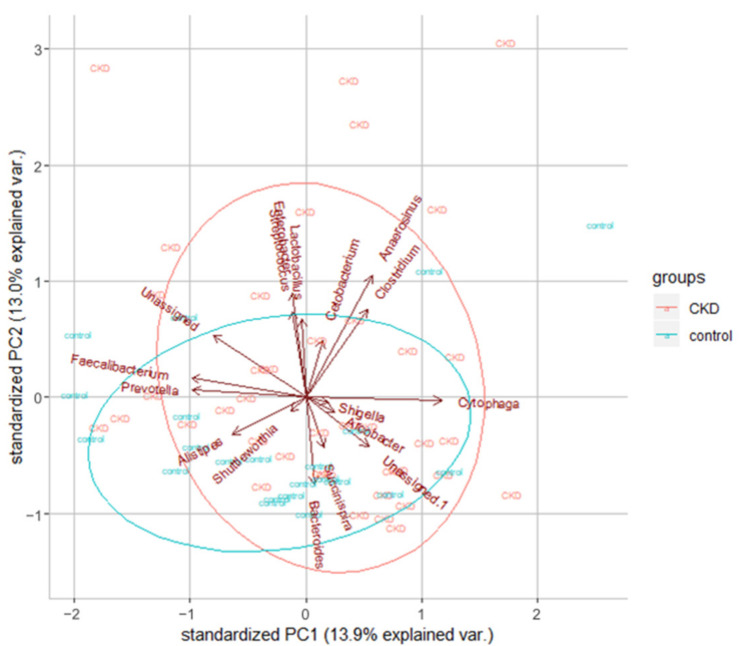
Figure 4.
Dimension reduction analysis reveals the overall bacterial compositions slightly different between healthy controls and ESKD patients. The top 20 most abundant microbial genera were used in this analysis and shown with arrows in the plot. Red and green ellipses were plotted according to the 40 ESKD patients and the 22 healthy controls, respectively.

