Figure 5.
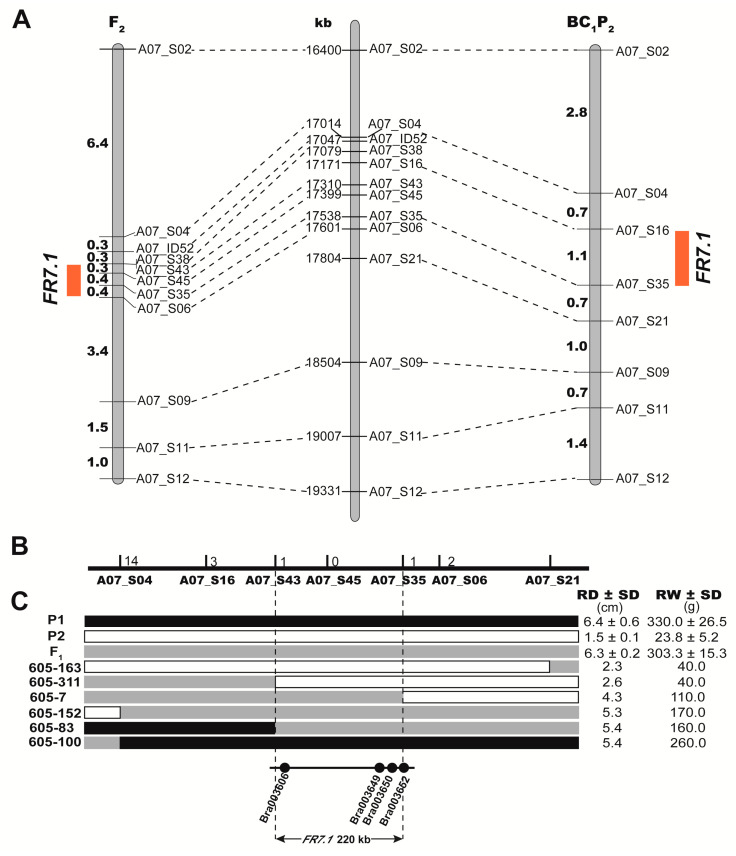
Mapping of the swollen root related quantitative trait loci (QTLs). (A) Locations of the FR7.1 (Fleshy root 7.1) locus on two linkage maps. The left and right linkage maps were constructed using F2 and BC1P2 populations, respectively. Numbers show the genetic distances between adjacent markers (cM), the red box denotes the QTL peak position. The map located in the middle of two linkage maps is a physical map of B. rapa A07 chromosome in the target region of the FR7.1 locus. Numbers show the physical distances; (B) Fine mapping of the FR7.1 locus in B. rapa. The numbers on the black line represent the number of recombinants at the corresponding markers; (C) Recombinants in the position of FR7.1 between SNP markers A07_S04 and A07_S21 (upper figure). RD: root diameter. RW: root weight. SD: standard deviation. The corresponding genes annotated according to the reference genome are presented in the 220 kb interval region (lower figure).

