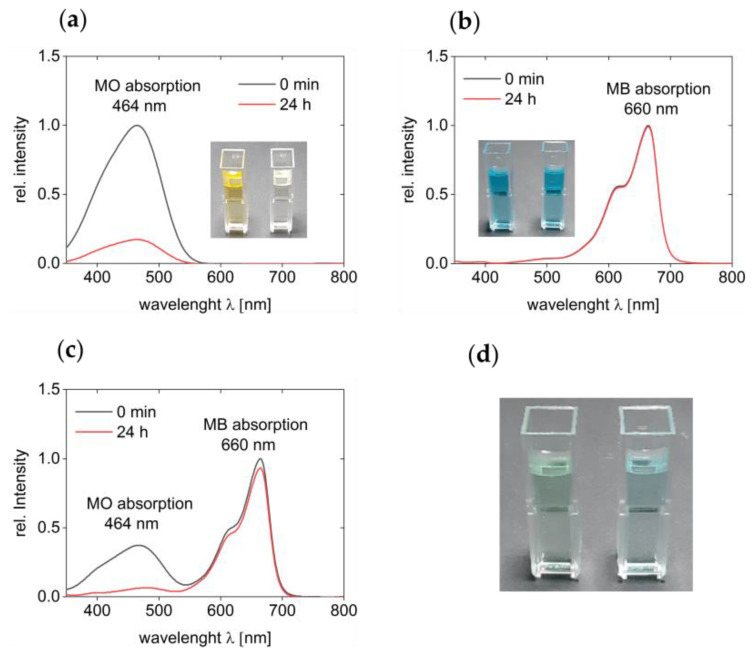
Figure 2.
UV–VIS spectra of dye solutions. (a) Spectra of MO solutions before the adsorption experiment (0 min; black line) and after 24 h (red line) of incubation with cryogel, (b) spectra of MB solutions before and after the experiment. Individual spectra of both measurements as individual spectra are shown in Appendix B, (c) spectra of 1:1 solutions containing both MO and MB before and after adsorption. All insets show cuvettes before (cuvette on the left) and after adsorption (cuvette on the right). (d) Photograph of cuvettes containing the MO/MB mixtures before (left) and after (right) the adsorption experiment.

