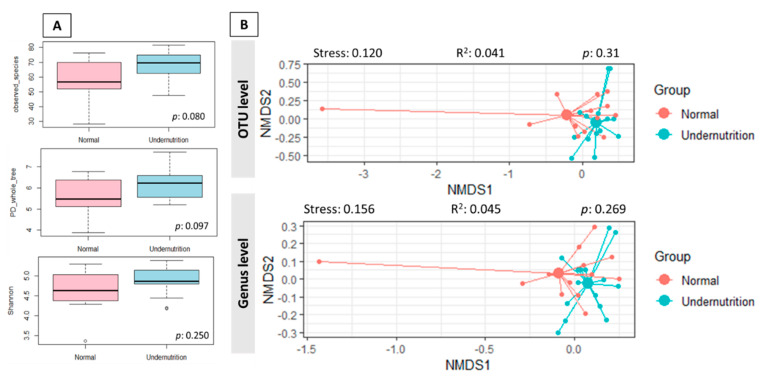
Figure 2.
(A). Alpha diversity of gut microbiota between normal and undernutrition group. The difference between the group was analyzed using the Wilcoxon rank-sum test (B). The Bray–Curtis dissimilarity-based NMDS between normal and undernutrition group. Each data point in the graph stands for a sample. The distance between data points reflects the similarities between samples. The stress factor < 0.2 indicates the reliability of the result.

