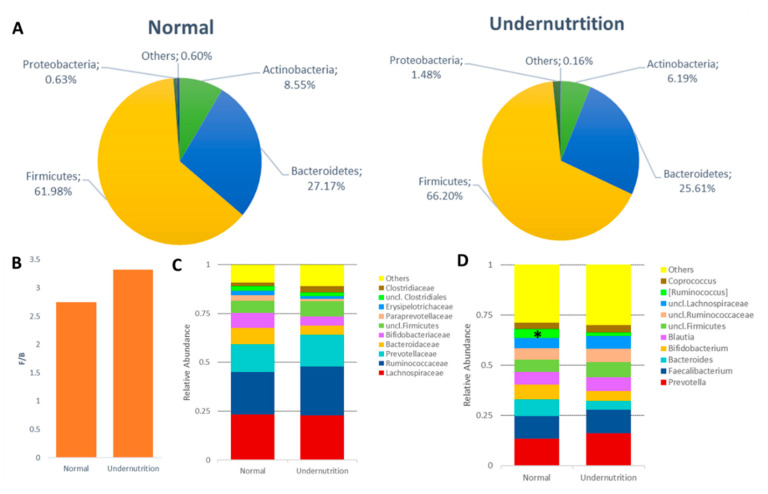
Figure 3.
Gut microbiota profile between normal and undernutrition group. (A) The difference in the phylum level of gut microbiota between normal and undernutrition groups. (B) Firmicutes and Bacteroidetes ratio (F/B) between normal and undernutrition group. (C) top 10 relative abundance of family between the group. (D) top 10 relative abundance of genus between the group. * means significantly different (p < 0.1).

