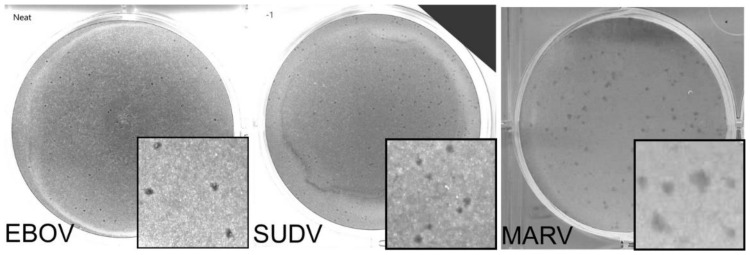
Figure 2.
Representative images of CVMO plaque assay for EBOV, MARV, and SUDV. Here, a single well from a 6 well plate is used as a representative image for EBOV (left), SUDV (middle), and MARV (right) with insets (3.5 mm width) showing a magnified area. Images have been changed to greyscale to increase plaque visibility. Plaques may be faint, as seen in the EBOV image, or form a dark CVMO aggregate, as seen in MARV. These are counted to give the final sample titer. Dilutions used here: EBOV 1:1, SUDV 10−1, MARV 10−1.

