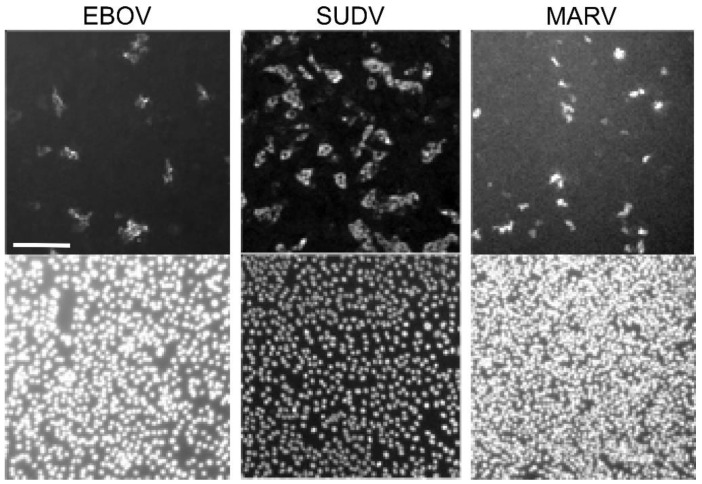
Figure 5.
Representative images of FFU (Focus-Forming Unit) assays in EBOV, MARV, and SUDV. Here, a representative image for EBOV (left), SUDV (middle), and MARV (right) is shown. Scale bar shown on EBOV image is representative for all images, 0.2 µm. Both nuclei (Hoechst 33,342, bottom) and immunostained viral protein (top) are pictured here. Viral titers are calculated by using a free, open-source software, CellProfiler, to count foci and nuclei. Foci generally consist of 2–5 cells. Sudan virus shown here consisted of 2–8 cells per foci. For example, the full SUDV image produced a foci count of 530 and a nuclei count of 8587. The CellProfiler output image has been included as Supplementary Figure S1.

