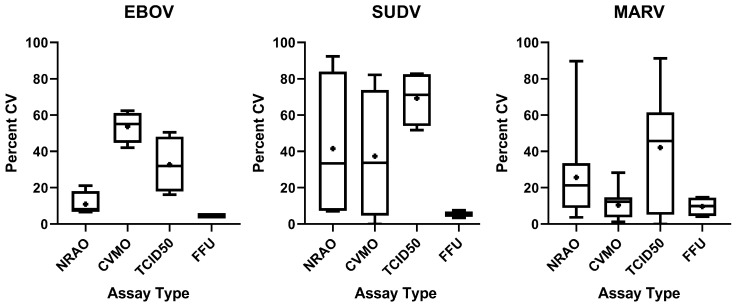
Figure 7.
Coefficient of Variance for each assay and virus type. Assays were completed in EBOV (left), SUDV (middle), MARV (right). Assay outcomes were compared on different days and between two operators. Coefficient of Variance (CV) was determined in R Studio by dividing standard deviation by the mean and converted into a percentage. In addition, MARV CV was calculated between two operators and analysts. EBOV and SUDV CV represents variance between two operators alone. Box-and-Whisker plots display median (bar) as well as Min/Max ranges. Symbol inside each bar indicates mean.

