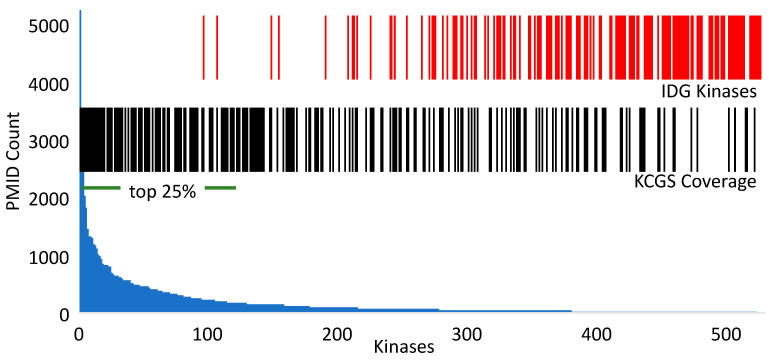
Figure 1.
Analysis of kinase coverage in KCGS by publication frequency. The blue histogram indicates the number of publications for each kinase in PubMed (Table S2) [24,25] ordered by frequency with the top 25% noted by the horizontal bar. The red vertical bars indicate the 162 poorly studied dark kinases nominated by the NIH Illuminating the Druggable Genome (IDG) initiative [7]. The black vertical bars indicate the 215 kinases covered by an inhibitor in KCGS version 1.

