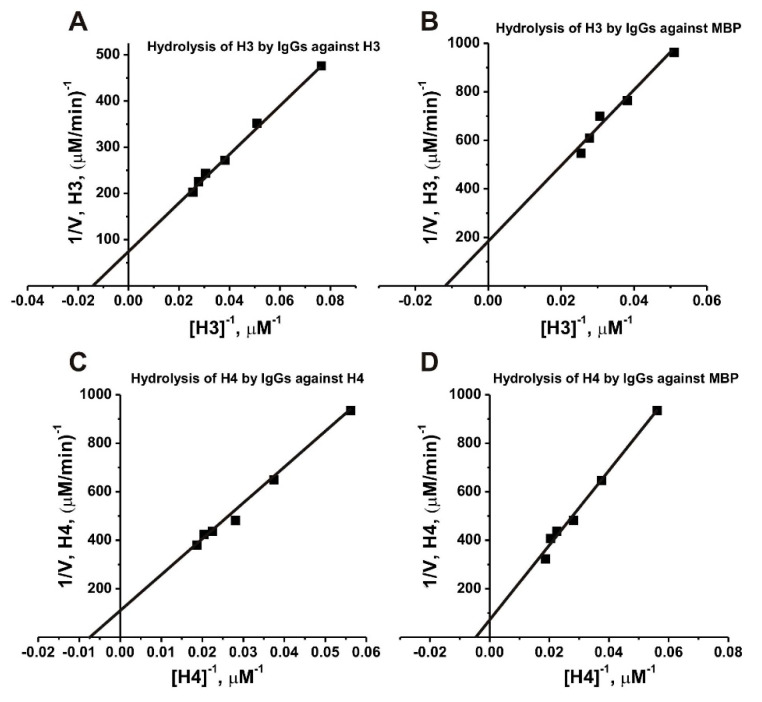
Figure 9.
Determination of the values of Km and Vmax (kcat) for H3 and H4 substrates in their hydrolysis by IgGs against MBP (A) and (B), respectively; 0.04 mg/mL) and by abzymes against H3 (C); 0.022 mg/mL) and H4 (D; 0.02 mg/mL) using a Lineweaver-Burk plot. The average error in the initial rate estimation at each substrate concentration from two independent experiments did not exceed 10%–20%.

