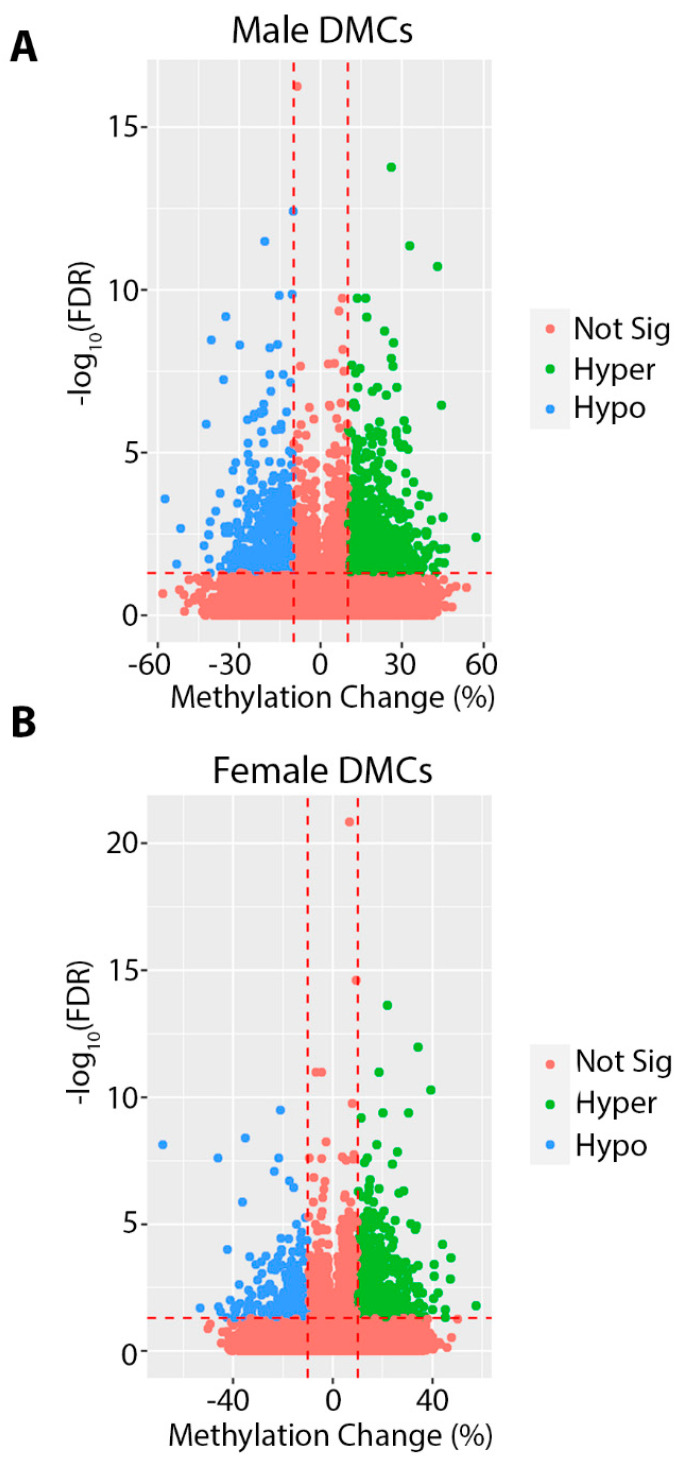
Figure 3.
Volcano plots depicting differentially methylated cytosines (DMCs) for Pb exposed compared to control in males (A) and females (B). DMCs in red did not meet the criteria for significance (at least a 10% change in methylation and FDR < 0.05). Significantly hypomethylated DMCs are shown in blue, and significantly hypermethylated DMCs are shown in green.

