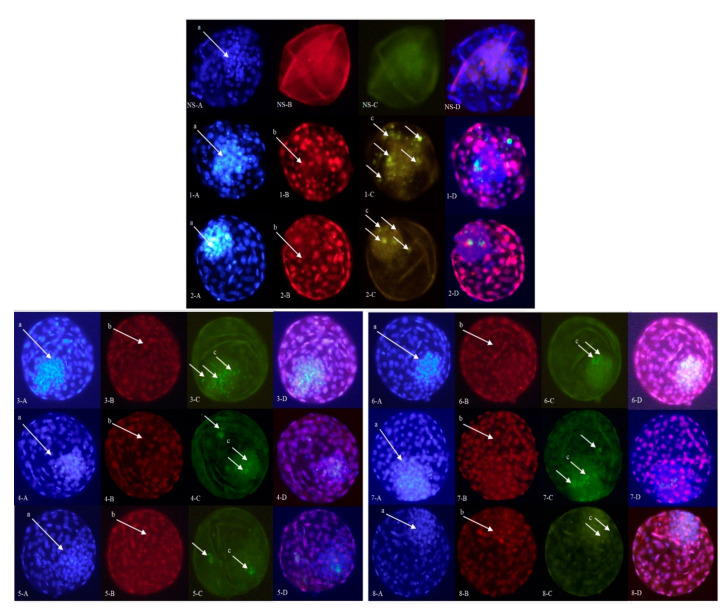
Figure 2.
Differential apoptotic staining of the expanded blastocysts (eight groups) (A–D). Representative blastocysts of all groups (1–8) are presented (see Experimental Design of the Materials and Methods and Figure 4 for details). NS: negative staining control. Both the trophectoderm (TE) and inner cell mass (ICM) (arrow a) nuclei were stained with Hoechst (1.A–8.A). The CDX2 antibody (labeled with Texas Red) resulted in a red fluorescent signal in TE cells (arrow b) (1.B–8.B). Apoptotic cells (arrow c) showed a green fluorescent signal (anti-caspase 3 antibody labeled with FITC) (1.C–8.C). Merged pictures (1.D–8.D) (40× magnification).

