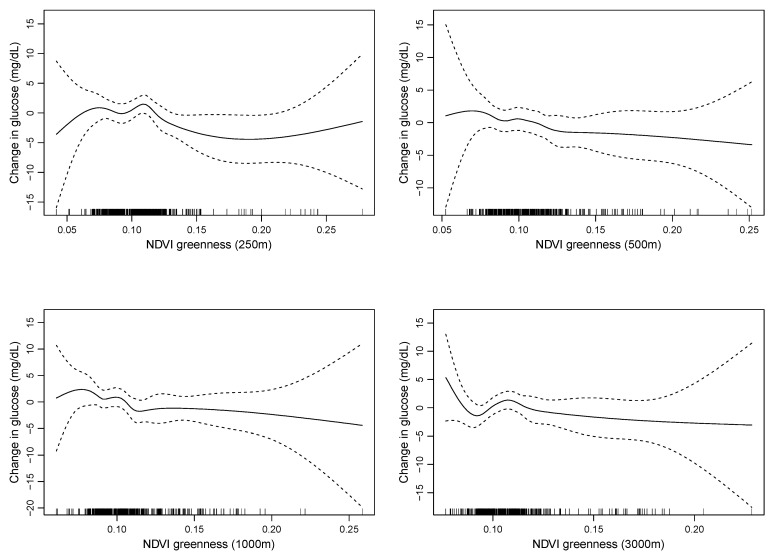
Figure 4.
Penalized splines for the association between greenness measured at difference buffer sizes and changes in fasting glucose levels from generalized additive models adjusted for age, gender, Hispanic ethnicity, race, and socioeconomic status (maternal education level and income over poverty ratio). The solid line represents the change in glucose levels (y axis) as a function of the exposure (x axis) with tick marks on the x axis representing individual data points of the exposure distribution. Dotted lines represent 95% confidence intervals for the change in glucose levels.

