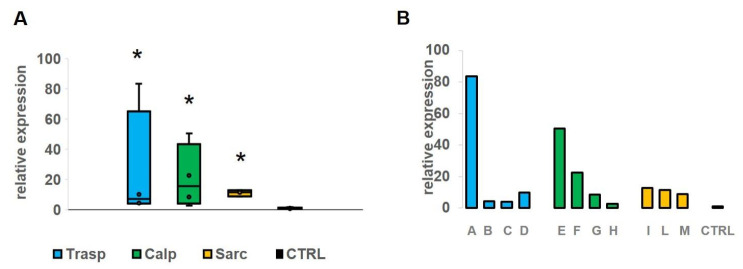
Figure 3.
(A) The figure shows the expression level of miR-206 in four patients with transportinopathy (blue), in four with calpainopathy (green) and in three with sarcoglycanopathy (yellow). We found a significant (p < 0.05) up-regulation of miR-206 in all groups comparing with the control group. (B) On the right (panel B) we show a single patient value of miR-206 that appears particularly elevated in patients A and E in comparison with the mean of controls. *: significant value.

