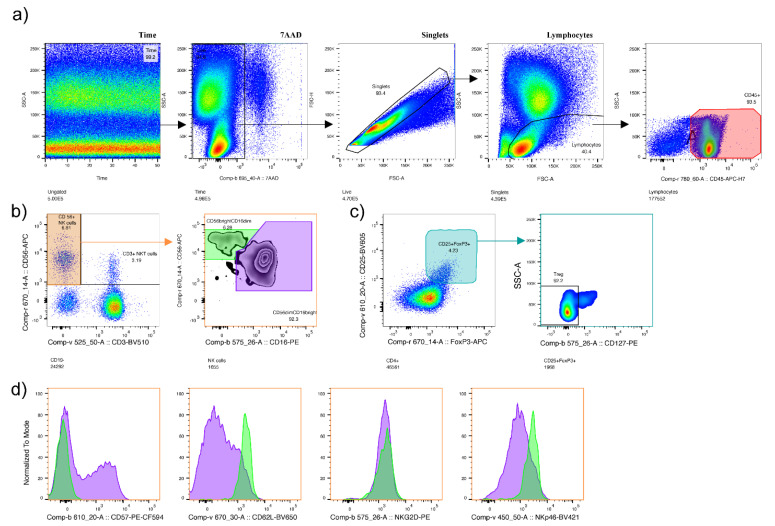
Figure A1.
Gating strategy. (a) Cells were gated according to flow stability (Time), live cells (7AAD−), singlets (pulse geometry to remove doublets) and size. (b) The characterization of natural killer cells (NK-cells) (CD56+CD3-, orange gate), NKT-cells (CD56+CD3+), CD56brightCD16dim (green gate), and CD56dimCD16bright (purple gate), (c) The characterization of T regulatory cells as CD25+FoxP3+CD127low. (d) The expression of CD57, CD62L, NKG2D and NKp46 in CD56brightCD16dim (green histogram) and CD56dimCD16bright (purple histogram).

