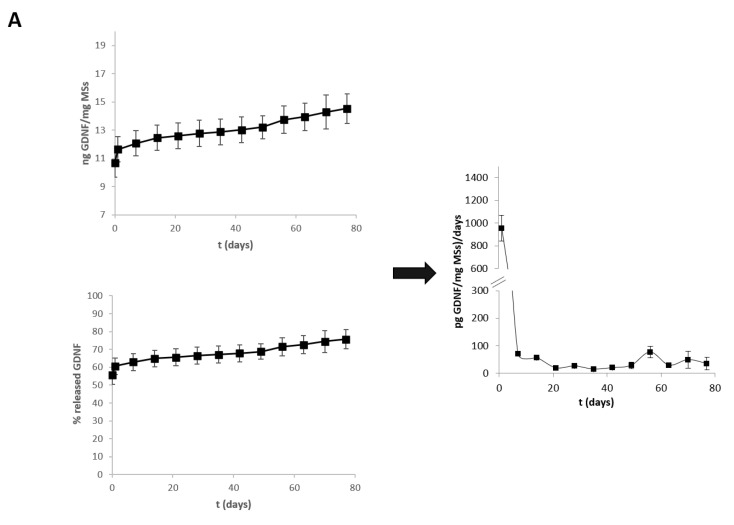
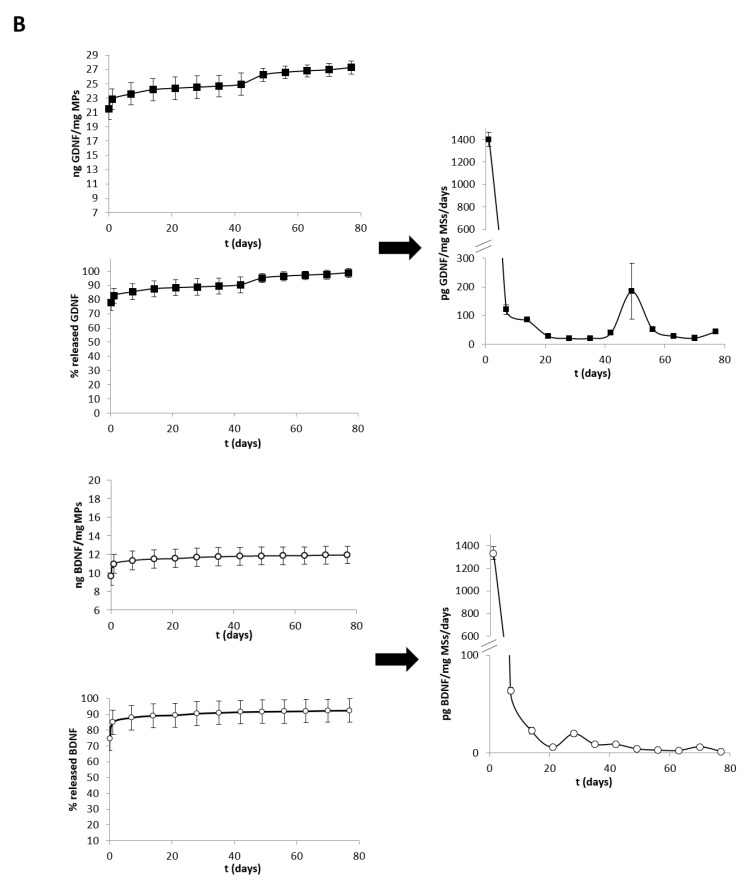
Figure 2.
Release profiles of NTFs from PLGA/VitE matrices are presented expressed as cumulative ng NTF/mg MSs, cumulative % of total loaded protein and the release rate of NTF (pg NTF/mg MSs/day). (A) GDNF release from GDNF-loaded MSs. (B) GDNF (■) and BDNF (○) release from GDNF/BDNF-loaded MSs. Release media: PBS (pH 7.4) with 1.0% of BSA and 0.02% sodium azide.


