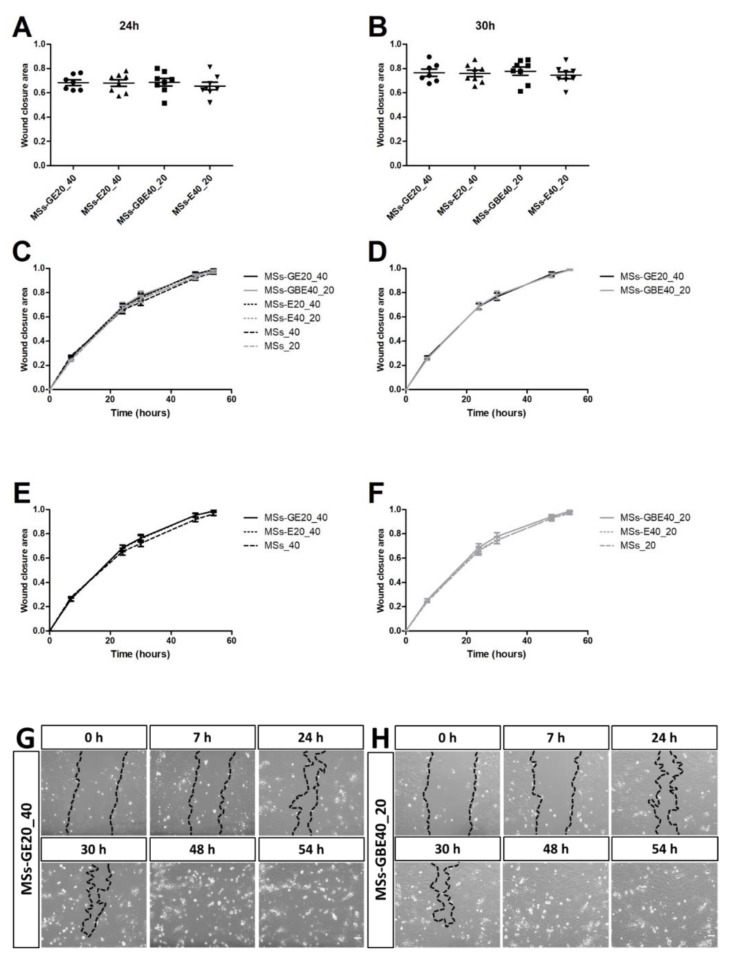
Figure 5.
Wound closure in RF/6A cells represented by scatter plot and representative images. No statistically significant differences were found at 24 and 30 h (A,B) post-scratching. Moreover, wound closure pattern were similar for both treatments, MSs-GE (−) and MSs-GBE (−) in RF/6A cells at 0, 7, 24, 30, 48 and 54 h after scratch as shown in graphs (C–F) and representative images (G,H). Black dotted lines indicate the wound borders at the different time points and treatments. Black dotted lines indicate the wound borders at the different time points and treatments. Blank MSs (MSs_20) and (MSs_40); GDNF/VitE(20)-loaded PLGA MSs (MSs-GE20_40); GDNF/BDNF/VitE(40)-loaded PLGA microspheres (MSs-GBE40_20). Scale bar: 100 µm. n = 7–9.

