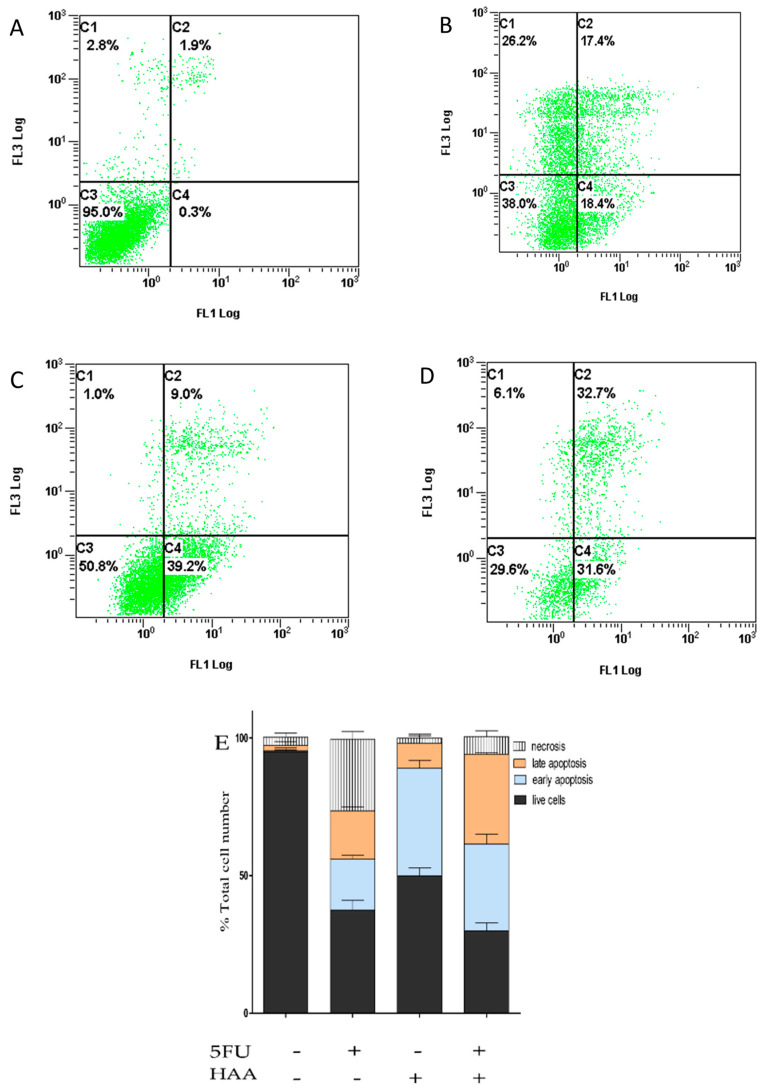
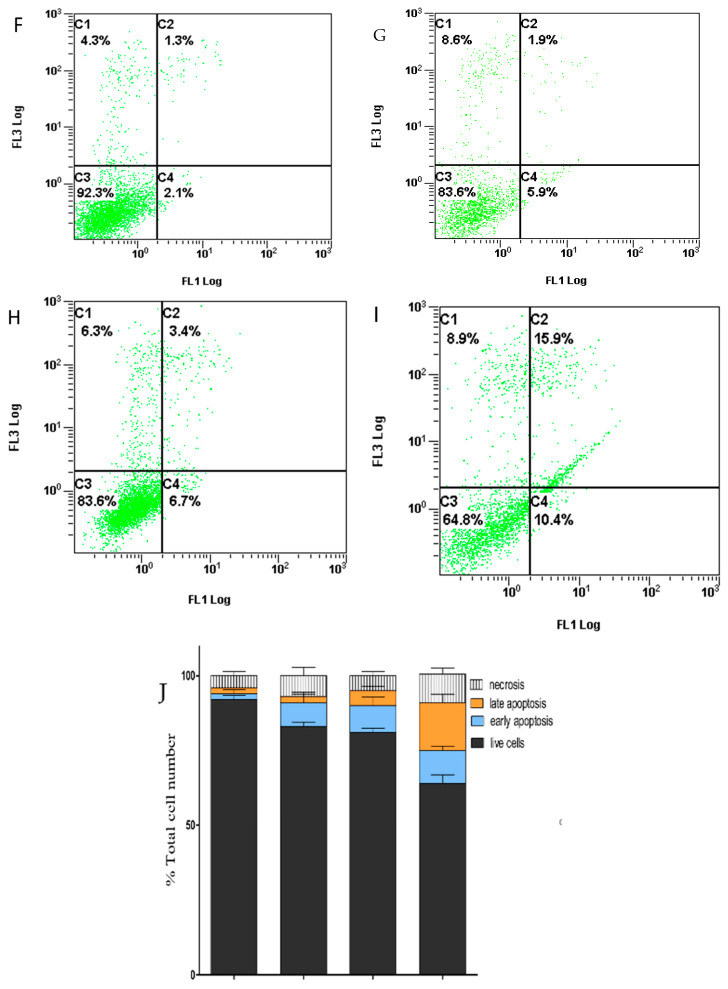
Figure 9.
Induction of apoptosis in HT29 and HT29-5FU cells (mean ± SD, n = 3, x3 independent experiments), which were treated (72 h) with either (A,F) vehicle, (B,G) 5FU (0.25 µM), (C,H) HAA2020 (3 µM), or (D,I): their combination. Stacked histograms of the different drug treatments in (E): HT29 and (J): HT29-5FU cells. C1: necrosis, C2: late apoptosis, C3: live cells, C4: early apoptosis.


