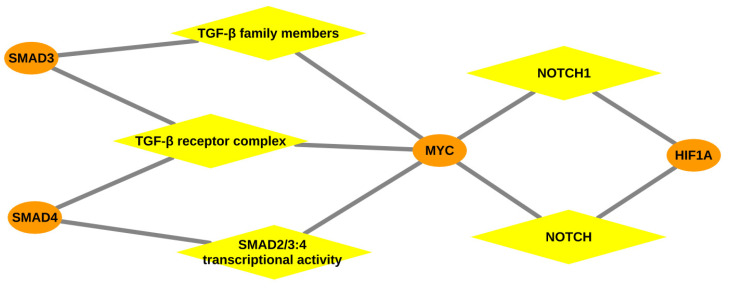
Figure 3.
Gene-pathway network: Network representing the association between the over-represented pathways and transcription factors especially MYC, depicted for the liver tissue of Boran. Orange coloured ellipses in the network represent the transcription factor genes and yellow coloured rhombuses indicate the over-represented pathways. The transcription factors are connected to the pathways, thereby forming a network of interactions between them.

