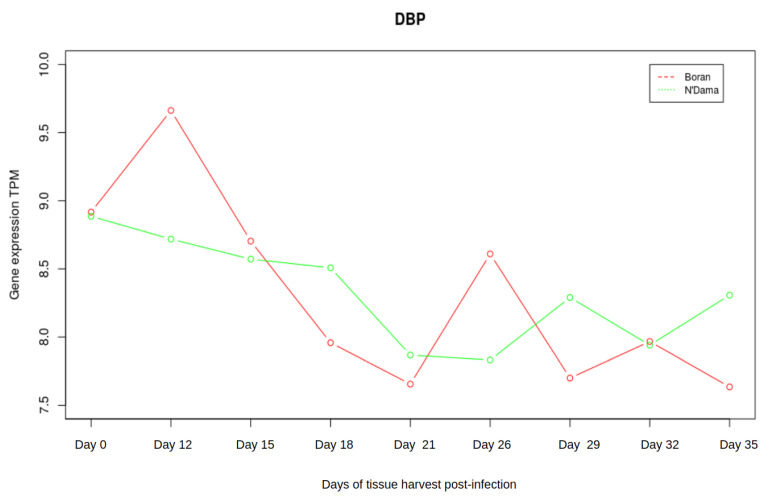
Figure 6.
Expression of DBP. The red line in the plot corresponds to Boran whereas the green line corresponds to the breed N’Dama. In the early timepoints, expression of DBP reaches a peak in Boran and then starts to drop down. After the timepoint 5, the curve again increases slightly and at the later stages, it falls down again. On the other hand, the expression of DBP in N’Dama steadily drops until the timepoint 5, then it gradually increases.

