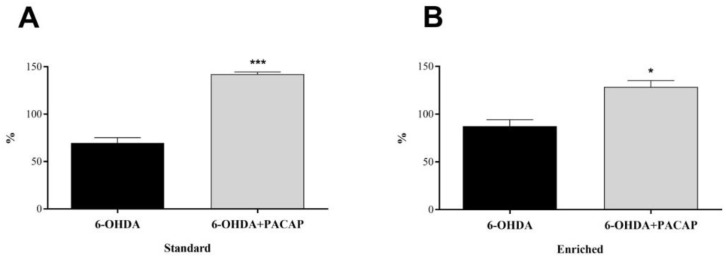
Figure 4.
Percentage of PARK7 content of the s.n. of the injured side compared to undamaged, control side of (A) standard and (B) enriched rats. Values are given in percentage, as mean ± S.E.M. A two-sample t-test was used for the statistical analysis. (A) *** p < 0.001 versus 6-OHDA-treated animals of the same group. (B) * p < 0.05 versus 6-OHDA-treated animals of the same group.

