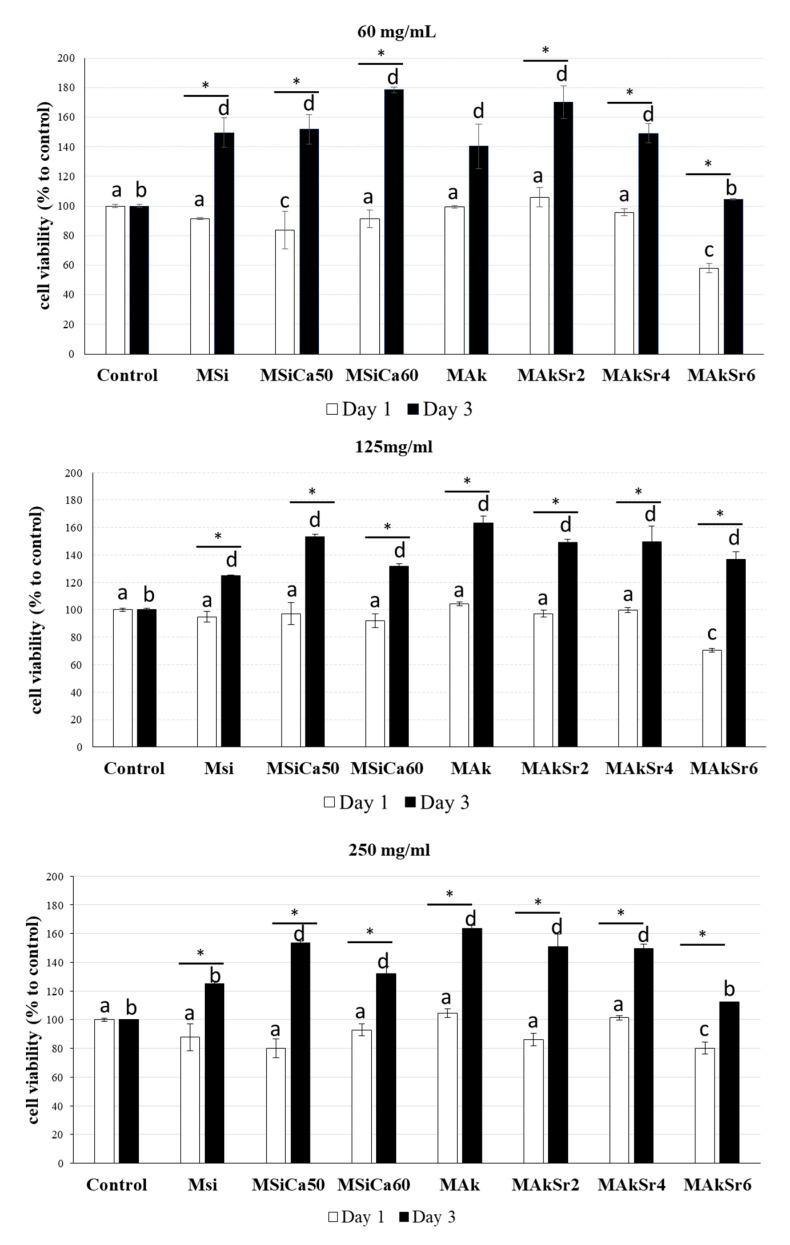
Figure 10.
MTT results of cell viability at different concentrations of mesoporous silica-based nanoparticles (MSNs) (μg/mL). * indicates statistically significant difference (p < 0.05) between Day 1 and Day 3, while different letter above columns indicates statistically significant differences from control at Day 1 (a,c) and Day 3 (b,d).

