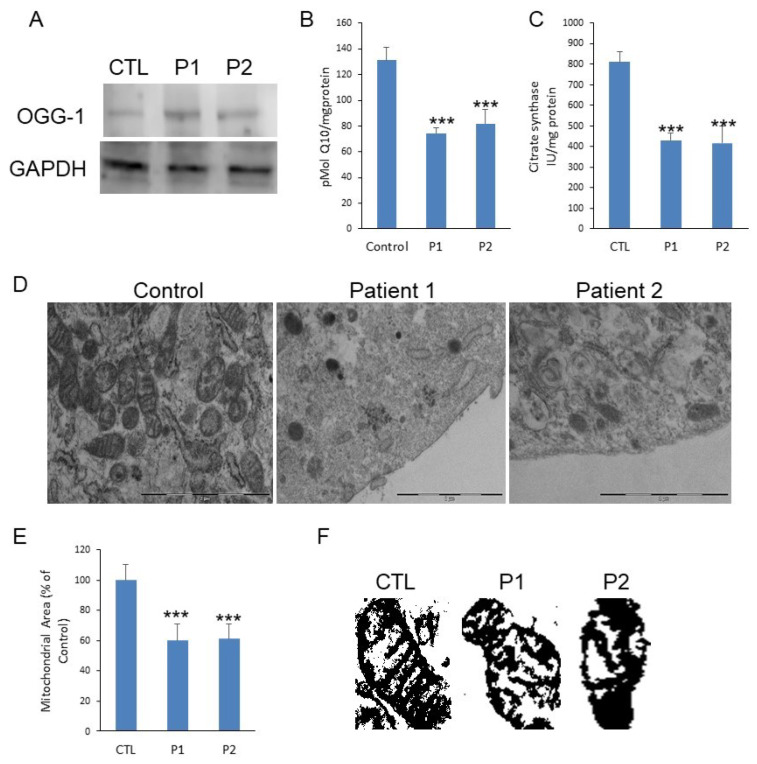
Figure 1.
(A). Protein expression levels of OGG-1 were determined in Papillon-Lefevre Syndrome fibroblast cultures by Western blot analysis compared with a pool of two control subjects, as described in Materials and Methods. GAPDH was used as a loading control. (B). CoQ10 levels were measured by HPLC. Data represent the mean ± SD of three separate experiments. (C). Citrate Synthase specific activity in fibroblasts from PLS fibroblast compared with a pool of two healthy age-matched and sex-matched control subjects, was performed by enzymatic activity. Data represent the mean ± SD of three separate experiments. * p < 0.05; ** p < 0.01; *** p < 0.001 between control and PLS patients (D). Transmission electron microscopy of representative control fibroblasts showing mitochondria with typical ultrastructure and number and low number of mitochondria present in PLS fibroblasts with aberrant structure. Scale bar 2 µm. (E). Mitochondrial area of PLS patients compared with control fibroblasts. (F). Representative masks of individual fibroblasts mitochondria from control and patients to show aberrant structure with alterations of cristae.

