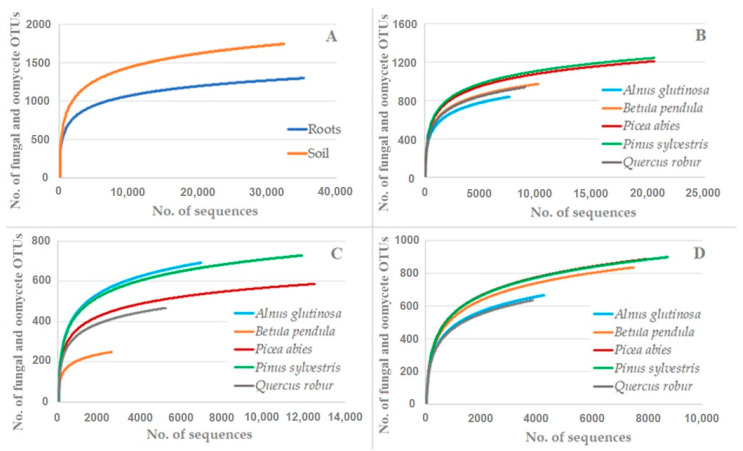
Figure 2.
Rarefaction curves showing the relationship between the cumulative number of fungal and oomycete OTUs and the number of ITS rRNA sequences compared: (A) roots vs. soil; (B) the different tree species (roots and soil samples combined); (C) root samples of the different tree species; and (D) soil samples of the different tree species.

