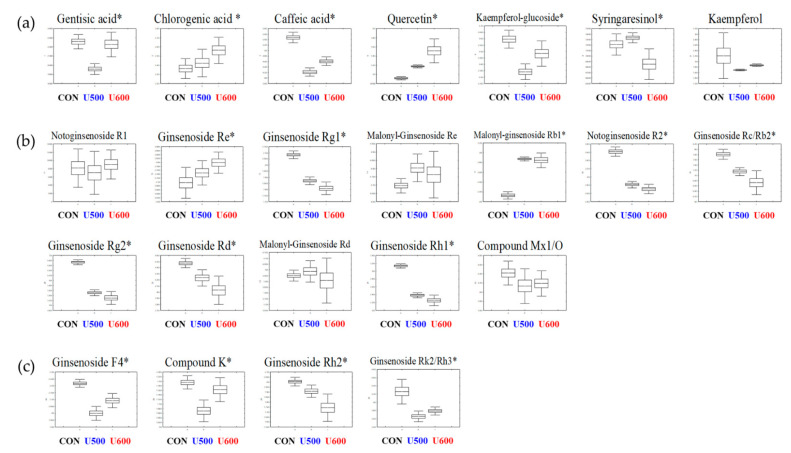
Figure 3.
Box and whisker plots of significantly different metabolites among GBPs obtained after different UHP processing treatments. (a) Phenolic compounds; (b) polar ginsenosides; (c) less polar ginsenosides. Relative contents of metabolites of GBPs were calculated as a relative peak area in UHPLC-LTQ-Orbitrap-MS/MS analysis. The metabolite content corresponds to the relative peak area plotted in the Y-axis. (Line, mean; box, Standard error; whisker, standard deviation) The GBP obtained after different UHP processing treatments plotted in the X-axis. (CON, control; U500, 500 MPa; U600, 600 MPa) * p-value < 0.05.

