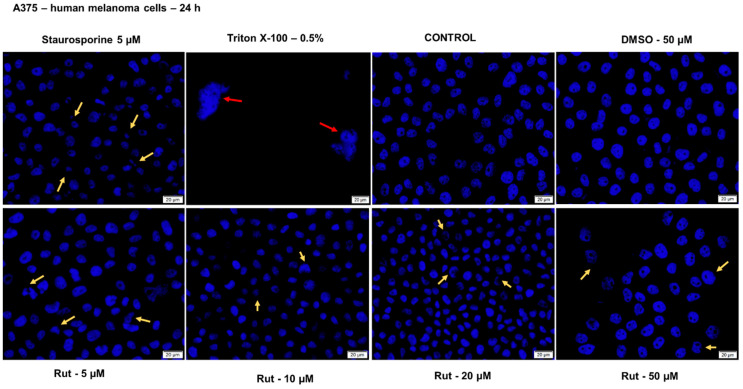
Figure 13.
Cell nuclei staining using Hoechst 33342 in A375 cells after treatment with Rut (5, 10, 20 and 50 µM) and DMSO for 24 h. The pictures were taken 24 h posttreatment. Staurosporine solution (5 µM) represents the positive control for apoptotic changes at the nuclear level and Triton X-100 solution (0.5%) for necrosis. The yellow arrows indicate apoptotic cells with nuclear fragmentation, and the red arrow indicates necrotic cells. The scale bars represent 20 µm.

