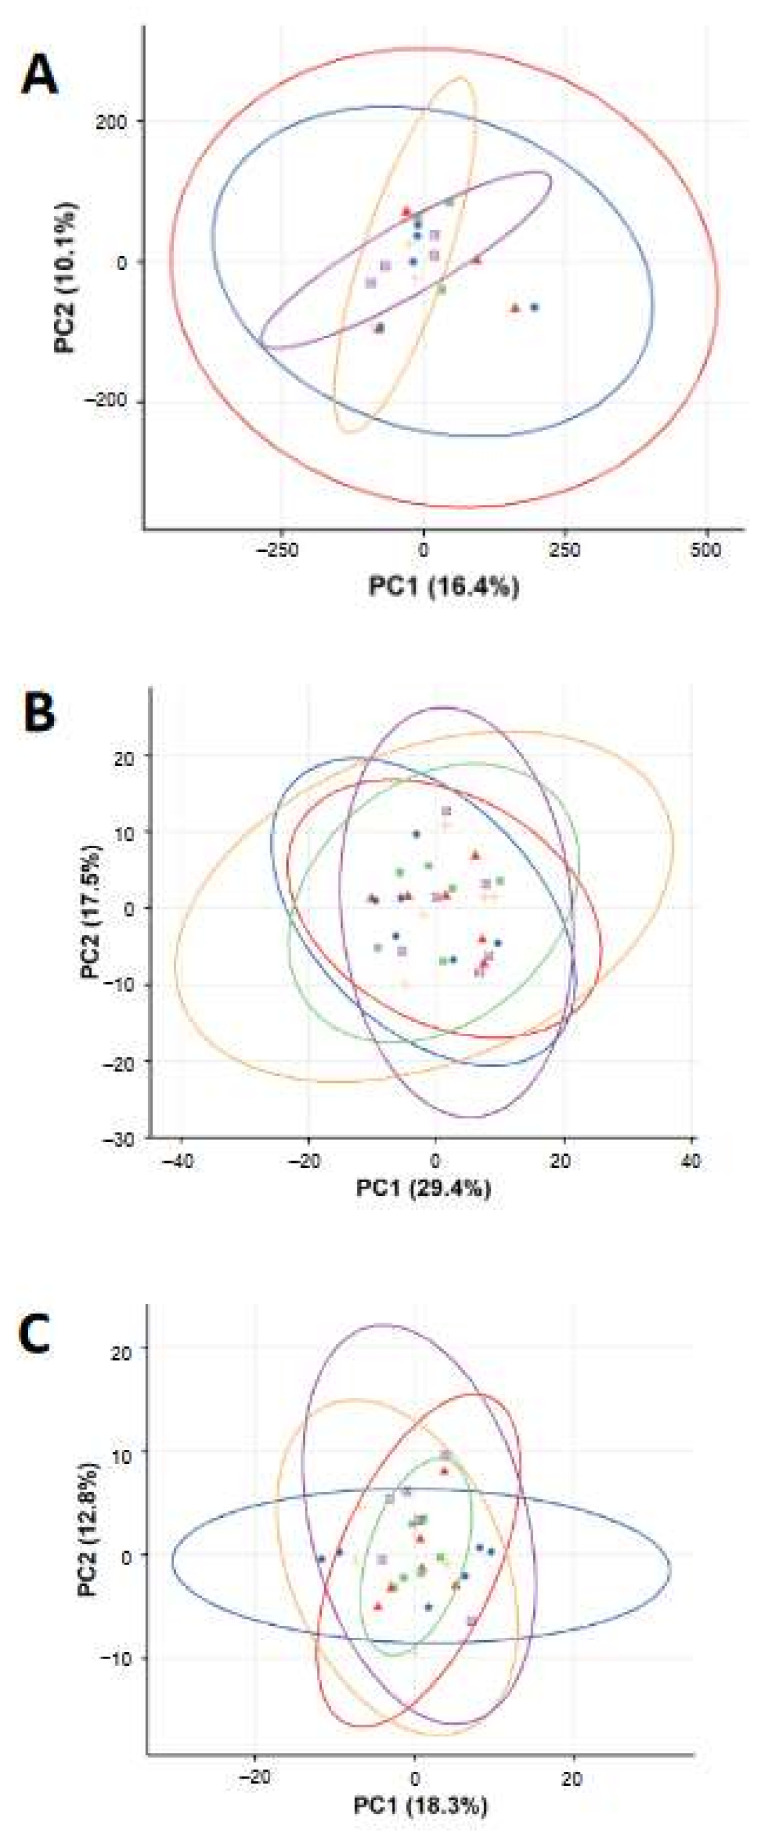
Figure 3.
Principal component analysis (PCA) score plots of the gene expression (A) and metabolomics profiles ((B) in positive ion mode and (C) in negative ion mode) of BEAS-2B cells treated with H2O and FeOxNPs. Symbols in the PCA plots indicate individual repeats of BEA-2B cells of control group (circle  ) or exposed to Fe3O4 B (triangle
  ), FeOx-mix A (square
  ), FeOx-mix B (plus
  ), and FeOx-mix C (plus
  ).
).

