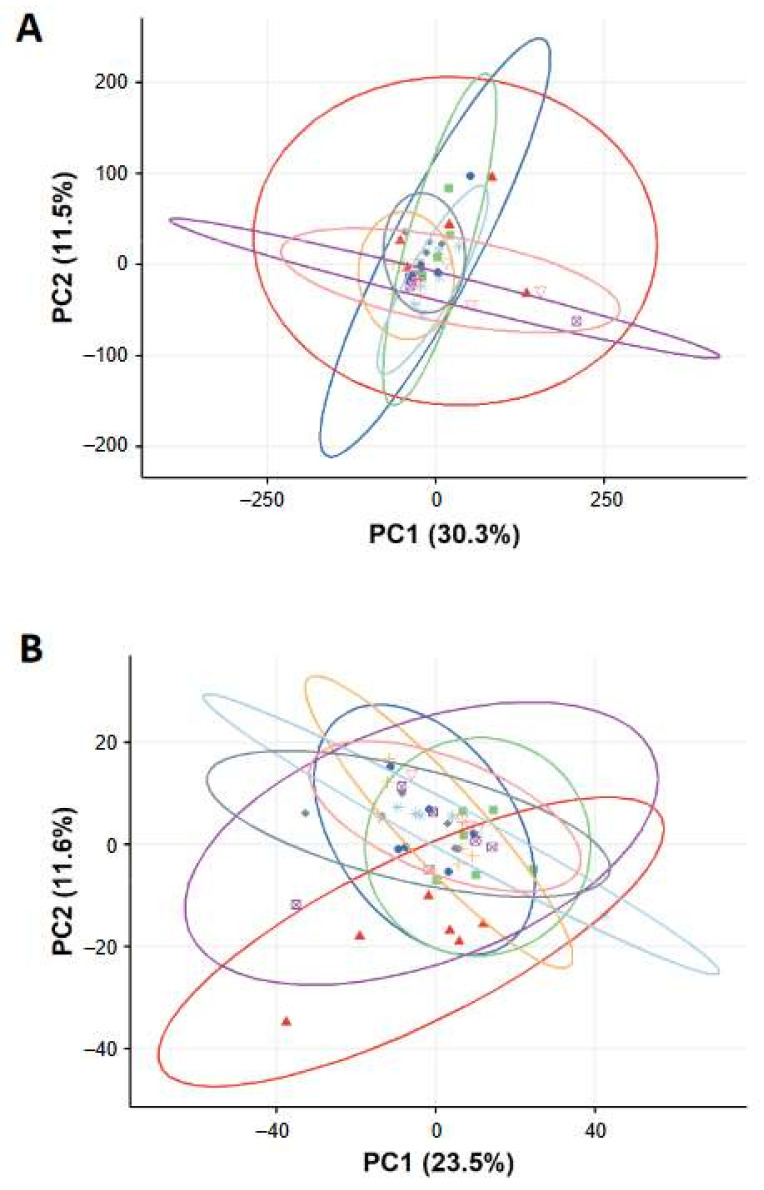
Figure 6.
Principal component analysis (PCA) score plots of the gene expression (A) and metabolomics profiles (B) of lung tissue from rats exposed to control and FeOxNP aerosols. Symbols in the PCA plots indicate individual samples of rat lungs exposed to Water at one day (circle  ) or 7 days (triangle
  ) post-exposure, Fe3O4 (low dose) at one day (square
  ) or seven days (plus
  ) post-exposure, Fe3O4 (high dose) at one day (square with cross
  ) or seven days (astrix
  ) post-exposure, and FeOx-mix (high dose) at one day (diamond
  ) and seven days (inverted triangle
  ) post-exposure.

