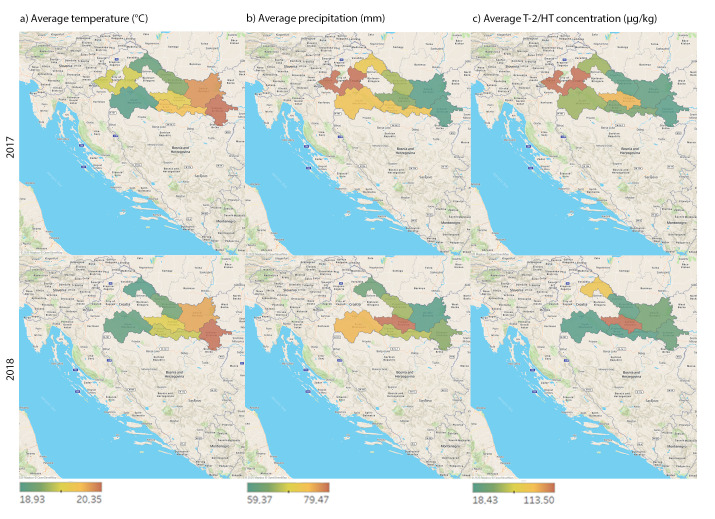
Figure 1.
Maps representing regional weather and sum T-2/HT-2 toxin concentrations obtained in unprocessed cereals in three Croatian cereal-producing regions during 2017 and 2018 (May–October): (a) average temperatures (°C); (b) average precipitation (mm); (c) mean sum T-2/HT-2 toxin concentrations (positive samples, >LOD of the ELISA method).

