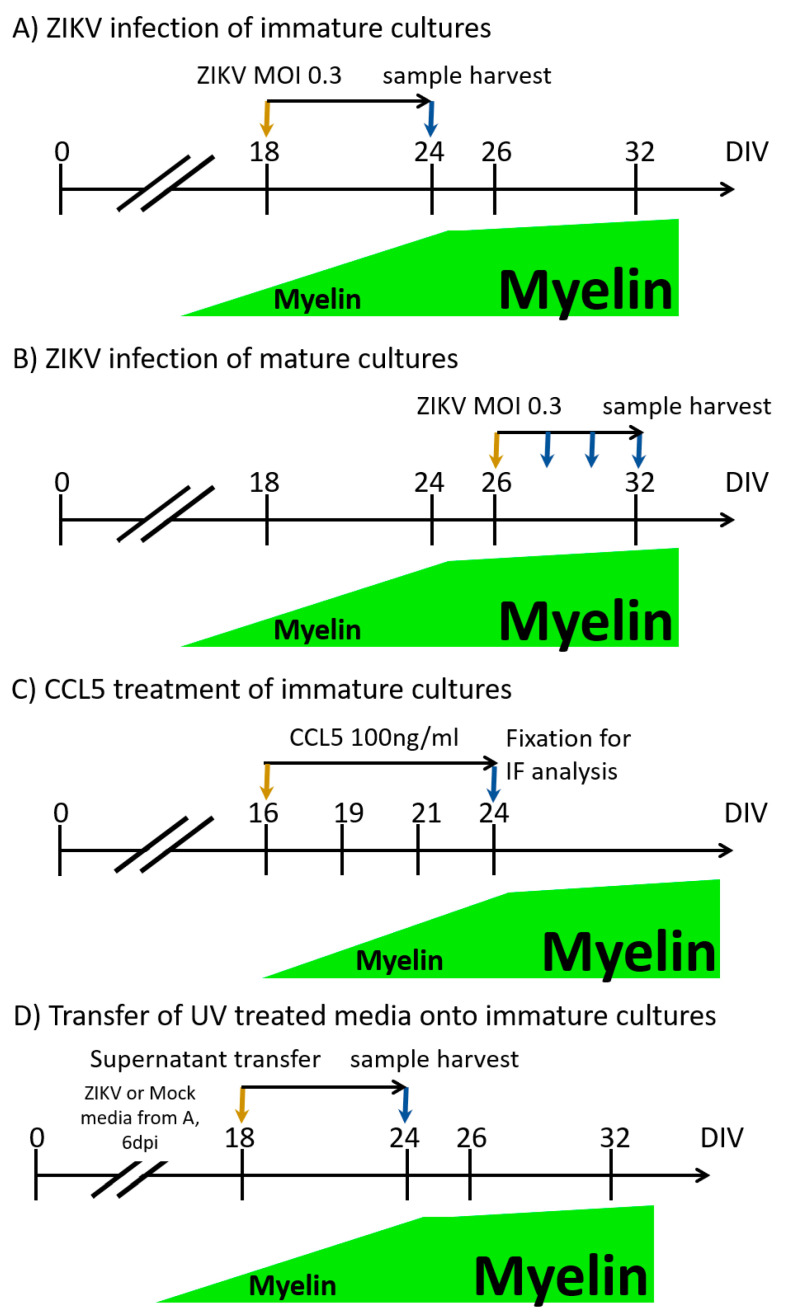
Figure 1.
Schematic of central nervous system (CNS) cultures infected with Zika virus (ZIKV) or treated with CCL5. Orange arrows indicate the start of infection or treatment, while blue arrows indicate the day of sampling for either analysis by immunofluorescence (IF) or RNA isolation. To establish how the ZIKV infection of immature mouse CNS cultures (A) compares to ZIKV infection of mature CNS mouse cultures (B) with regard to infection and pathology, cultures were infected with ZIKV at an multiplicity of infection (MOI) of 0.3 or mock-infected (referred to as Mock in figures) and analyzed by IF after 6 dpi using our previously established protocols [44]. Cultures were always matched, so immature and mature cultures were derived from the same pool of spinal cord cells (embryonic spinal cords of one dam, taken at E13). To assess the progress of infection in mature mouse CNS cultures (B) and transcriptome changes, cultures were infected in the same manner, and samples were harvested at 2 and 4 dpi. (C) CCL5 treatment of rat CNS cultures was carried out from day in vitro (DIV) 16 until DIV 24. Cultures were fixed and analyzed by IF. (D) To determine whether soluble factors contributed to the observed pathology in ZIKV-infected cultures, the supernatant of ZIKV infected cultures was harvested at 6 days post-infection (dpi) (from cultures as described under (A)) and UV-inactivated. Then, supernatant (diluted 3:1 with fresh medium) was transferred onto immature CNS cultures, and cells were fixed 6 days post-transfer (dpt).

